
Introduction
The term obesity or adiposity is used for excess weight, specifically high body fat, as stated by the American Heart Association.1 It is a well-known fact that obesity increases the risk for various metabolism-linked disorders such as hypertension, diabetes mellitus, cardiovascular conditions, joint issues, etc. Obesity is measured by body weight and body mass index (BMI). The distribution of body fat can be measured using waist circumference, waist-to-hip ratio (WHR), and waist-to-height ratio (WHtR). In addition to this, measurement of body fat percentage, muscle mass, bone mass, and visceral fat are important for clinical assessments. There are several techniques for the measurement of body composition.2 In clinical settings, commonly used techniques are anthropometric measurements, skinfold thickness, bioelectrical impedance analysis (BIA), ultrasound, hydrostatic weighing, air displacement plethysmography, dual X-ray absorptiometry (DEXA), etc. However, the most easily applicable techniques in day-to-day use are anthropometric indices and BIA for clinical and community settings. However, these methods to measure obesity/adiposity and central obesity are expensive. Central obesity is the most harmful in terms of various metabolic disorders and conditions.3-5 A cutoff of 0.5 for WHtR has been suggested as the first level of risk.6 A simple index such as WHtR is a good proxy for central obesity and has great practical advantages.7 This explains that “waist circumference should be half of the height”, which is the rationale for this study. The “string test” concept was first described by Dr. Margaret Ashwell and Dr. Sigrid Gibson.8,9 The laboratory equipment/expensive techniques needed for screening central obesity can be replaced by a simple “string test” to check the ratio of waist circumference to height in Indian population. Therefore, this pilot study aimed to explore the prevalence of central adiposity among young adults using traditional methods and a string test.
Materials and Methods
This observational study was conducted among young adults in the age group of 18-25 years. It was a pilot study of the proposed work, and the sample size was decided on the basis of the prevalence of a similar study.9 The sample size for this pilot study was computed using the Cochran formula, and it was computed as n = 40.11 The inclusion criteria comprised healthy young adults in the age group of 18-25 years. An equivalent number of males and females were included to ensure the equal participation of both genders. Whereas the exclusion criteria were young adults diagnosed with any metabolic disease such as diabetes mellitus, hypertension, kidney diseases, thyroid disorders, etc., and those taking any hormonal therapy or medications. The study was carried out as per the principles stated in the Declaration of Helsinki. The research proposal and protocol were approved by the Research Advisory Committee of SNDT Women’s University and the Ethics Committee of Jehangir Clinical Development Centre (JCDC/BHR/24/053).
Before enrolling in the study, willing participants were informed about the study, and their written consent was undertaken. Study participants were recruited in this pilot study from August to October 2024. All the instruments for anthropometric measurements were calibrated before the data collection. Additionally, field assistants were trained, and their interobserver variance was verified to ensure the standardization of the adopted techniques.
Sociodemographic information
A questionnaire on socio-demographic information included the age, gender, educational details, and occupational details of the participants.
Medical history
This included information about the participant’s health-related history, and current health issues if any. Detailed information on substance abuse was recorded.
Measurement of anthropometric parameters
The anthropometric measurements were taken using a standard protocol wherein the participants were asked to wear appropriate light garments.
Height – A stadiometer (SECA 213) was used for the measurement of height. The participants were asked to stand straight on the stadiometer, without shoes and head positioned in the Frankfurt plane. The height was documented to the nearest 0.1 cm.
Weight – A calibrated digital weighing scale (TANITA BC533) was used for the measurement of weight. The weight measurement was done after removal of the footwear.
Body mass index (BMI)
BMI was computed using the formula: BMI = Weight (kg)/Height (m)2
The participants were then categorized into BMI categories for Asia-Pacific countries.12,13 According to these, participants will be categorised as underweight (BMI <18.5 kg/m2), normal (BMI 18.5-22.9 kg/m2), overweight (BMI 23-24.9 kg/m2), obese (BMI 25 kg/m2).
Waist circumference and hip circumference – A non-stretchable tape (SECA 201) was used for waist and hip circumference measurements. Study participants were instructed to stand upright, with their feet held together for both measurements. The midpoint between the lower rib and iliac crest was identified to measure the waist circumference. The hip circumference was measured at the maximum protruding circumference around the buttocks. The waist-to-hip ratio (WHR) was computed using the standard formula waist circumference in cm divided by hip circumference in cm.6
Waist-to-height ratio – The formula to compute the waist-to-height ratio (WHtR) was waist circumference in cm divided by height in cm. It indicates the risk for metabolic conditions. The categories for WHtR observations were no risk (<0.49), at-risk (0.5-0.6), and high risk (>0.6).14
Ashwell® string test
A non-stretchable jute twine string (‘Sutali’) was used. The length of the string was measured from head to toe of the study participant. Then the measured string was folded in half and using this folded string, the participant’s waist circumference was assessed. The observations of the string test were noted as the string sufficient, string overlapped, and the gap between the two ends of the string. Then the participants were categorized as ‘at risk’ if the folded string was smaller than the waist circumference.9
Statistical analysis
Statistical Package for Social Sciences (SPSS) software v. 16.0 for Windows was used to perform the statistical analysis. The data analysis was reported referring to the STROBE guidelines.15 Baseline data was reported using descriptive statistics. The association between variables was tested using Pearson’s and Kendall’s Tau-b tests. The reliability of this pilot study was tested by calculating Cronbach’s alpha. The data was considered significant if p <0.05.
Results
A total of 40 young adults participated in the study where 20 (50%) were males and 20 (50%) were females. The mean age of the study participants was 21.3±2.26 years (18-24 years). Table 1 describes the anthropometric measurements of the study participants. The waist circumference was within the normal range as per WHO standards in females and males.6 However, WHR and WHtR were observed to be on the borderline among females. Weight (ρ=0.371, p<0.05), waist circumference (ρ=0.387, p<0.05) and WHR (ρ=0.411, p<0.05) were correlated positively with sting test categories in females which was significant. Also, WHtR (ρ=0.486, p<0.01) showed a highly significant correlation with string test categories in females. There was no significant correlation observed for anthropometric parameters and string test categories among males.
Table 1: Anthropometric parameters across the participants
|
Anthropometric Parameters |
Mean (SD) | |
| Females |
Males |
|
|
Height (cm) |
157.06±9.78 | 167.68±9.15 |
| Weight (Kg) | 55.85±15.46* |
62.58±12.08 |
|
BMI (Kg/m2) |
22.26±5.12 | 22.38±3.27 |
| WC (cm) | 78.91±12.73* |
72.90±18.57 |
|
HC (cm) |
96.24±13.87 | 99.20±21.13 |
| WHR | 0.82±0.07* |
0.74±0.16 |
|
WHtR |
0.50±0.07** |
0.44±0.10 |
*Significant correlation with String test categories (p<0.05)
**Significant correlation with String test categories (p<0.01)
Abbreviations: BMI Body Mass Index; WC Waist Circumference; HC Hip Circumference; WHR Waist-to-hip ratio; WHtR Waist-to-height ratio.
The mean BMI was observed to be 22.26±5.12 Kg/m2 and 22.38±3.27 Kg/m2 among females and males respectively, which was within the normal category as per WHO Asia Pacific standards.12,13 Figure 1 illustrates the distribution of males and females across BMI categories. About one-third of the female participants (30%) were in normal BMI category, whereas half of the male participants (50%) were in the normal BMI category. About 15% of females and 35% of males were overweight and 20% of females were obese.
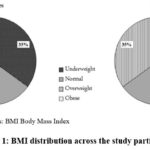 |
Figure 1: BMI distribution across the study participants |
Abbreviations: BMI Body Mass Index
The WHtR is an indicator of the central adiposity. According to the NICE guidelines14 for WHtR, 0.4-0.49 indicates a healthy ratio. A ratio of 0.5-0.59 and greater than 0.6 respectively represent an increase in central adiposity posing a greater health risk.7 Figure 2 represents the observed WHtR categories. It was observed that 40% of females and 45% of males were at risk and 15% of females were in the high-risk category. Our findings reported that 45% of females and 55% of males were in ‘no risk’ category.
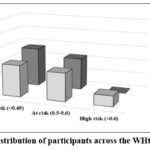 |
Figure 2: Distribution of participants across the WHtR categories |
The Ashwell® string test was first advocated in 2006 as a simple method used for primary screening of central adiposity. It was further emphasized that a string test can be cost-effective in community settings for central adiposity assessment.9
Figure 3 depicts the string test observations among study participants. The folded string was found to be sufficient in 5% of females and 25% of males, the string overlapped among 65% of females and 60% of males, and a gap was observed in two ends of the folded string among 30% of females and 15% of males. These observations indicate that 12 (30%) females and 6 (15%) males were in the ‘at risk’ category. The mean gap between the two ends of the folded string was 5.25±3.31 cm which is approximately a 3-finger gap.
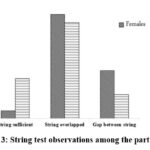 |
Figure 3: String test observations among the participants |
The string test observations correlated significantly with WHtR categories (τb = 0.367, p<0.05). This indicated that the string test observation criteria concur with the WHtR categories. The correlation was studied between WHtR and the gap between the two ends of the string. Pearson’s correlation showed that WHtR correlated significantly with the gap between two ends of the string (r = 0.512, p<0.01).
The commonly used method in measuring the internal consistency of a tool is by calculating Cronbach’s Alpha coefficient.11 The reliability score was α=0.67 for WHR and α=0.68 for WHtR, whereas it was α=0.71 for string test observations. Overall Cronbach’s Alpha correlation was α=0.68 indicating an acceptable level of reliability.16
Discussion
In this pilot study, 40 young adults participated with a ratio of 50:50 for males and females. The mean age of the participants was 21.3±2.26 years ranging between 18 to 24 years. WHR and WHtR were at the borderline among females while the waist circumference was within normal limits as per WHO standards. A study based on NFHS-517 done in India reported parallel findings, where 32.2% of women between the age of 20-29 years had abdominal obesity. The mean BMI was within the normal category as per WHO Asia Pacific standards which was 22.26±5.12 Kg/m2 and 22.38±3.27 Kg/m2 among females and males respectively.12 But 15% of females and 35% of males were overweight and 20% of females were obese. The ICMR-INDIAB study has indicated that BMI above 21 Kg/m2 increases the risk of central obesity. Similarly, our observations for obesity prevalence among females from Maharashtra correspond with findings by the ICMR-INDIAB study.10
About 40% of females and 45% of males were at risk and 15% of females were in the high-risk category of WHtR. These findings were comparable with the observations of the study conducted in the UK reporting 48% of women and 40% of men in at-risk category.18
The string test observations showed that the mean gap between two ends of the folded string was 5.25±3.31 cm which is equivalent to 3 fingers gap. A similar remark was made by Ashwell M,9,18 denoting that a gap between two ends of the string indicates the health risk and a reduction in this gap will reduce the health risk. A significant correlation was observed between the string test observations and WHtR categories as well as between WHtR and the gap between the two ends of a string. These findings suggest the use of a simple string for a dichotomous assessment of central adiposity.19,20
The reliability of this tool in this pilot study was found to be statistically acceptable, hence, it can be used as a reliable tool in the assessment of central adiposity in the Indian population.
Conclusion
Central adiposity is one of the major risk factors for health and central adiposity is on a rise in the Indian urban and rural population. Traditionally, obesity and adiposity are assessed by BMI, WHR, and WHtR, which require several equipment and trained personnel for measurements. This pilot study is an attempt to find an alternate and a non-cumbersome way of assessing central adiposity at the clinical as well as in community setup. The Ashwell® string test was used to measure the central adiposity. It showed a statistically significant correlation with WHtR. Additionally, string test observation categories correlated significantly with WHtR categories. The use of the string test for screening has been included in the Government policy of Thailand and is also being used in the United Kingdom for community projects. Thus, this pilot study emphasized the use of a string test as an easy way of self-screening.
Acknowledgment
The authors would like to thank SNDT Women’s University and the Ethics Committee of Jehangir Clinical Development Centre for their support. The authors are also grateful to M.Sc. CND second-year students from SNDT College of Home Science, Pune for field assistance. The findings from this paper were presented at the 56th Annual National Conference of Nutrition Society of India.
Funding Sources
The research was supported by the SNDT Women’s University under the research fund for Minor Research Project (Acad/PP/2022-23/1574).
Conflict of Interest
The authors report no conflict of interest to declare.
Data Availability Statement
This statement does not apply to this article.
Ethics statement
The Research Advisory Committee of SNDT Women’s University and the Ethics Committee Jehangir Clinical Development Centre (JCDC/BHR/24/053) approved the research proposal and protocol.
Informed consent statement
The study was conducted in accordance with the principles indicated in the Declaration of Helsinki. Written informed consent was obtained from the willing participants before enrolment in the study.
Clinical trial registration
This research does not involve any clinical trials.
Author contribution
- Anuja Kinikar: Conceptualization, Study protocol, Funding acquisition, Supervision, Writing – original draft
- Harshada Thakur: Conceptualization, Methodology, Data collection, Data Analysis, Writing – review and editing
- Aakanksha Salve: Methodology, Data collection, Project administration, Writing – review and editing
References
- Cornier M.A., Després J.P., Davis N., Grossniklaus D.A., Klein S., Lamarche B., Lopez-Jimenez F., Rao G., St-Onge M.P., Towfighi A., Poirier P. Assessing adiposity: a scientific statement from the American Heart Association. Circulation. 2011; 124(18): 1996-2019. DOI: https://doi.org/10.1161/CIR.0b013e318233bc6a
CrossRef - Rico‐Martín S, Calderón‐García JF, Sánchez‐Rey P, Franco‐Antonio C, Martinez Alvarez M, Sánchez Muñoz‐Torrero JF. Effectiveness of body roundness index in predicting metabolic syndrome: a systematic review and meta‐analysis. Obesity Reviews. 2020;21(7):1-23. DOI: https://doi.org/10.1111/obr.13023
CrossRef - Lam B.C., Koh G.C., Chen C., Wong M.T., Fallows S.J. Comparison of body mass index (BMI), body adiposity index (BAI), waist circumference (WC), waist-to-hip ratio (WHR) and waist-to-height ratio (WHtR) as predictors of cardiovascular disease risk factors in an adult population in Singapore. PloS one. 2015; 10(4): 01-15. DOI: https://doi.org/10.1371/journal.pone.0122985
CrossRef - Tee J.Y., Gan W.Y., Lim P.Y. Comparisons of body mass index, waist circumference, waist-to-height ratio and a body shape index (ABSI) in predicting high blood pressure among Malaysian adolescents: A cross-sectional study. BMJ open. 2020; 10(1): 01-09. DOI: https://doi.org/10.1136/bmjopen-2019-032874
CrossRef - Zhang F.L., Ren J.X., Zhang P., Jin H., Qu Y., Yu Y., Guo Z.N., Yang Y. Strong association of waist circumference (WC), body mass index (BMI), waist‐to‐height ratio (WHtR), and waist‐to‐hip ratio (WHR) with diabetes: a population‐based cross‐sectional study in Jilin Province, China. Journal of diabetes research. 2021; 2021(1): 01-09. DOI: https://doi.org/10.1155/2021/8812431
CrossRef - Consultation WE. Waist circumference and waist-hip ratio. Report of a WHO Expert Consultation. Geneva: World Health Organization. 2008. ISBN 978 92 4 150149 1
- Shrestha R., Upadhyay S.K., Khatri B., Bhattarai J.R., Kayastha M., Upadhyay M.P. BMI, waist to height ratio and waist circumference as a screening tool for hypertension in hospital outpatients: a cross-sectional, non-inferiority study. BMJ open. 2021; 11(11): 01-08. DOI: https://doi.org/10.1136/bmjopen-2021-050096
CrossRef - Ashwell M., Gibson S. A proposal for a primary screening tool: Keep your waist circumference to less than half your height’. BMC medicine. 2014;12(207): 01-06. DOI: https://doi.org/10.1186/s12916-014-0207-1
CrossRef - Ashwell M. How long is a piece of string. Less than half your height. Five steps from science to screening: a mini review. Adv Obes Weight Manag Control. 2017;7(2): 01-04. DOI: 10.15406/aowmc.2017.07.00191
CrossRef - Pradeepa R., Anjana R.M., Joshi S.R., Bhansali A., Deepa M., Joshi P.P., Dhandania V.K., Madhu S.V., Rao P.V., Geetha L., Subashini R. Prevalence of generalized & abdominal obesity in urban & rural India-the ICMR-INDIAB Study (Phase-I) [ICMR-INDIAB-3]. Indian Journal of Medical Research. 2015; 142(2):139-150. DOI: 10.4103/0971-5916.164234
CrossRef - Daniel W.W., Cross C.L. Biostatistics: basic concepts and methodology for the health sciences. 10th New Delhi: Wiley India Pvt. Ltd.; 2013.
- Tan K.C. Appropriate body-mass index for Asian populations and its implications for policy and intervention strategies. The Lancet. 2004; 363(9403): 157-163. DOI: http://dx.doi.org/10.1016/S0140-6736(03)15268-3
CrossRef - Lim J.U., Lee J.H., Kim J.S., Hwang Y.I., Kim T.H., Lim S.Y., Yoo K.H., Jung K.S., Kim Y.K., Rhee C.K. Comparison of World Health Organization and Asia-Pacific body mass index classifications in COPD patients. International journal of chronic obstructive pulmonary disease. 2017; 12: 2465-2475. DOI: https://doi.org/10.2147/COPD.S141295
CrossRef - National Institute for Health and Care Excellence. Obesity: identification, assessment and management. Clinical Guidelines: NICE Guidelines; 2023. Series number CG189
- Von Elm E, Altman DG, Egger M, Pocock SJ, Gøtzsche PC, Vandenbroucke JP. The Strengthening the Reporting of Observational Studies in Epidemiology (STROBE) statement: guidelines for reporting observational studies. The Lancet. 2007; 370(9596):1453-1457. DOI: 1016/S0140-6736(07)61602-X
CrossRef - Taber K.S. The use of Cronbach’s alpha when developing and reporting research instruments in science education. Research in science education. 2018; 48:1273-1296. DOI: https://doi.org/10.1007/s11165-016-9602-2
CrossRef - Chaudhary M., Sharma P. Abdominal obesity in India: analysis of the National Family Health Survey-5 (2019–2021) data. The Lancet Regional Health-Southeast Asia. 2023; 14(100208): 01-10. DOI: 1016/j.lansea.2023.100208
CrossRef - Ashwell M., Gibson S. Waist-to-height ratio as an indicator of ‘early health risk’: simpler and more predictive than using a ‘matrix’ based on BMI and waist circumference. BMJ open. 2016; 6(3): 01-07. DOI: 10.1136/bmjopen-2015-010159
CrossRef - Gibson S., Ashwell M. A simple cut-off for waist-to-height ratio (0·5) can act as an indicator for cardiometabolic risk: recent data from adults in the Health Survey for England. British Journal of Nutrition. 2020;123(6): 681-690. DOI: doi:10.1017/S0007114519003301
CrossRef - Ashwell M., Gunn P., Gibson S. Waist‐to‐height ratio is a better screening tool than waist circumference and BMI for adult cardiometabolic risk factors: systematic review and meta‐analysis. Obesity reviews. 2012;13(3): 275-286. DOI: https://doi.org/10.1111/j.1467-789X.2011.00952.x
CrossRef

This work is licensed under a Creative Commons Attribution 4.0 International License.


