
Introduction
Water yam (Dioscorea alata) starch, distinguished by its high amylose content and small granule size, possesses unique properties that lend it to diverse applications in the food and industrial sectors. In food applications, it serves as an effective thickening agent in soups, sauces, and desserts, imparting desirable viscosity and texture. The starch’s ability to form strong, transparent gels makes it particularly suitable for the production of noodles and edible films. Moreover, water yam starch gel exhibits good freeze-thaw stability, enhancing its value in frozen food products.1 Industrially, this starch gel is being explored as a biodegradable packaging material and as an adhesive in the paper and textile industries.2 Modifications such as hydrolysis and oxidation can further tailor its properties for specific applications, including improving its solubility and film-forming ability.3,4
Water yam starch modification is a rapidly expanding area of research focused on enhancing its inherent properties and broadening its applications. Scientists are exploring various physical methods, such as heat-moisture treatment and annealing, to improve freeze-thaw stability, pasting properties, and gel texture.5 Chemical modifications, including acetylation, oxidation, and acid hydrolysis, are employed to enhance paste clarity, film-forming ability, and resistance to retrogradation.6 Additionally, enzymatic modifications using α-amylase and pullulanase are being investigated to tailor the molecular weight distribution and pasting properties for novel functionalities.7,8 These modifications aim to optimize water yam starch’s performance in a diverse range of applications, including food products, pharmaceuticals, and bioplastics.
Partial hydrolysis of starch, achieved through acid, enzyme, or oxidizing agent treatments, cleaves starch molecules into smaller dextrins and oligosaccharides. This reduction in molecular weight and alteration of the amylose/amylopectin ratio leads to decreased viscosity and gel strength compared to native starch, attributable to reduced entanglement and network formation.7,9 Conversely, retrogradation, the re-association of gelatinized starch molecules upon cooling and storage, increases firmness, opacity, and syneresis in gels. This phenomenon is attributed to the formation of a more ordered structure with crystalline regions from amylose and an amorphous network from amylopectin, resulting in a tighter network that traps water.7,9 Combining hydrolysis with other modifications can create unique functionalities, such as reduced retrogradation and syneresis while maintaining desirable viscosity and gel-forming ability.
Starch, an abundant and renewable resource, is widely utilized in the food industry, primarily as a texture modifier. The properties of starch, along with its pastes and gels, are influenced by several factors, including botanical origin, concentration, shear rate, shear history, and gelatinization parameters. Understanding the rheological properties of starch pastes is crucial for optimizing its utilization in practical applications. Furthermore, comprehending the rheology of modified starch is essential due to its profound impact on functionality and performance across diverse applications. Rheological properties such as viscosity, elasticity, and gel strength dictate the texture, stability, and processing behavior of starch gels in food products.7,9 For instance, in food systems, these properties influence sensory attributes like mouthfeel and spreadability, as well as stability against syneresis and gravitational separation. In pharmaceutical applications, controlled drug release from gels hinges on their rheological characteristics. Moreover, for adhesives and coatings, the ability to form strong, stable bonds and films depends on the gel’s rheological response to stress and deformation.10 By understanding how modifications like hydrolysis, oxidation, or cross-linking affect the rheological behavior of the gel, we can tailor its properties for specific applications, optimize processing parameters, and achieve desired product attributes.
To our knowledge, the rheological properties of modified water yam starch have not been extensively studied. Therefore, the aim of this paper was to present the structure change and rheological properties of water yam starch modified by partial hydrolysis and retrogradation.
Materials and Methods
Preparation of water yam starch
Water yam tubers (purchased from a local market) were subjected to a rigorous cleaning process involving washing and peeling to eliminate extraneous materials such as soil, sand, and dust. The tubers were then diced into 1 cm cubes and immersed in a 0.2% NaOH solution at a 1:9 tuber-to-solution ratio. Following this alkaline treatment, the tubers were macerated in the NaOH solution and the resulting slurry was passed through a 100-mesh sieve. The filtrate was then subjected to repeated immersions in fresh 0.2% NaOH solution at 4-hour intervals for a total of 4-5 cycles. This alkaline extraction process facilitated the solubilization of pigments, proteins, pectin, and phenolic compounds, while insoluble fiber components were separated by flotation. Finally, the starch fraction was isolated by filtration of the suspension through a 200-mesh sieve.
To verify complete protein removal during the soaking process, the immersion liquid underwent ninhydrin testing. A 1.0 mL aliquot of the immersion liquid was transferred to a test tube and treated with 2 drops of ninhydrin reagent (prepared by dissolving 0.2 g ninhydrin in 10 mL of absolute ethanol). The tube was then sealed and heated in a boiling water bath for 10 minutes. The absence of a blue-violet color complex indicated complete protein removal, while the appearance of a blue-violet color signaled the need for further NaOH washes to eliminate residual protein.
Following protein removal, the solution was neutralized to pH 7 using 0.1N HCl. This neutralization process generated NaCl, necessitating thorough washing of the starch with distilled water to eliminate residual salt. The presence of NaCl was monitored by reacting 1.0 mL of the wash solution with a few drops of AgNO3. The formation of a white precipitate (AgCl) indicated the presence of chloride ions, requiring continued washing until no further precipitate was observed upon AgNO3 addition. The purified starch was then dried in a convection oven at 50°C to achieve a moisture content below 10%, pulverized, and sieved through a 200-mesh screen. The final starch product was stored in airtight packaging in a cool, dry place until further use.
Partly hydrolysis of starch
Acid hydrolysis of water yam starch was conducted based on established methods.11,12 A 3% (w/v) suspension of raw starch (12 g in 400 g distilled water) was gelatinized by heating in a boiling water bath (95°C, 30 minutes) followed by autoclaving (121°C, 15 minutes). After cooling to room temperature, 100 mL aliquots of the gelatinized starch were subjected to acid hydrolysis by adding 24 mL of 0.5 N HCl and incubating on a magnetic stirrer for predetermined time intervals to create a series of samples with different acidic hydrolysis durations (hours): H0 (non-hydrolysis), H4 (4 h), H10 (10 h), and H18 (18 h). These time points were selected based on the acid hydrolysis curve to achieve low, medium, high, and very high degrees of hydrolysis, respectively. Following acid hydrolysis, the reaction was neutralized with 1N NaOH to pH 7. The samples were then centrifuged at 8000g for 30 minutes to separate the supernatant.
The residual pellet was resuspended in water and subjected to repeated centrifugation cycles to ensure thorough salt removal. The absence of precipitate formation upon AgNO3 testing confirmed complete salt elimination. The washed pellet was then dried in a convection oven at <50°C until a moisture content of <10% was achieved. The dried sample was subsequently pulverized and passed through a 200-mesh sieve. These processed samples, designated as H0, H4, H10, and H18, corresponded to the 0-hour, 4-hour, 10-hour, and 18-hour hydrolysis time points, respectively.
Retrogradation of starch
Preparation of HR0, HR4, HR10, and HR18 samples involved the addition of water (60% v/v) to the salt-free starch gels of corresponding H0, H4, H10, and H18 samples. These mixtures underwent a controlled temperature cycling regime consisting of a cold phase (4°C for 18 hours) followed by a ambient phase (30°C for 6 hours), repeated for a total of 2 cycles (48 hours). Subsequently, the starch suspensions were centrifuged at 2400g for 10 minutes to remove excess water. The resulting pellets were thinly spread, dried in a convection oven (50°C, 24 hours), pulverized, and passed through a 200-mesh sieve. The final samples were stored in airtight packaging in a cool, dry environment until further analysis.
Reducing power (RP)
The reducing power of the starch samples was determined following a published method.13 Accurately weighed samples (0.2 g, on dry basis) of each starch type (N, H0, H4, H10, H18) were placed in centrifuge tubes and 10 mL of distilled water was added to each tube. The starch suspensions were thoroughly mixed and gelatinized by heating in a boiling water bath (95°C, 30 minutes) followed by cooling to room temperature. Complete gelatinization was ensured by autoclaving at 121°C for 15 minutes. The reducing power of the gelatinized starch solutions was then assessed using a colorimetric assay with 3,5-dinitrosalicylic acid (DNS) reagent. After the reaction, the mixtures were centrifuged (2400g, 10 minutes) and the absorbance of the supernatant was measured at 540 nm.14 Maltose was used as a standard, and the reducing power was calculated according to a previously established method:
![]()
Apparent amylose content (AM)
The apparent amylose content (AM, %) were determined according to a published method.15 A starch sample (0.1 g) was transferred to a 100 mL volumetric flask and moistened with 1.0 mL of ethanol. Subsequently, 10 mL of 1N NaOH solution was added, and the volume was made up to 100 mL with distilled water, followed by thorough mixing. An aliquot of this solution (2 mL) was then transferred to another 100 mL volumetric flask. To this, 50 mL of distilled water and 2 drops of phenolphthalein indicator were added. The solution was titrated to neutrality with 0.1 N HCl. Next, 2 mL of iodine solution (prepared by dissolving 2.0 g KI and 0.2 g I2 in 100 mL distilled water) was added, and the mixture was allowed to stand for 20 minutes. Finally, the absorbance of the starch-iodine complex was measured in a quartz cuvette using a UH5300 UV-Vis spectrophotometer over a wavelength range of 400 to 1000 nm. Apparent amylose content (AM, %) was then calculated as the following equation:
![]()
where “Diff ABS” denotes the difference in absorbance values measured at 620 nm and 510 nm.
X-ray diffraction pattern (XRD) and degree of relative crystallinity (DRC)
X-ray diffraction patterns of the starch samples were acquired using an X-ray diffractometer (D8 Advance Eco, Bruker) according to a previously described method.16 The instrument was operated at 40 kV and 40 mA with Cu-Kα radiation (λ = 0.15406 nm) over a scanning angle range of 3-30° (2 θ). The degree of relative crystallinity (DRC) was calculated using the following formula:17
where, Ac and Aa presents the area of the crystalline region and Aa represents the area of the amorphous region. DRC values was calculated using Origin 2022 software (OriginLab Corporation, U.S.A.).
Shear rate sweep
Shear rate sweep profiles of 7% (w/v) starch suspensions were evaluated using a HAAKE RheoStress 1 Rheometer (ThermoFisher Scientific, Germany) equipped with a PP35 plate-plate geometry (1.000 mm gap). Starch suspensions were gelatinized at 95°C for 30 minutes and cooled to room temperature (30°C) prior to analysis. Measurements were conducted at 30°C with an initial shear rate (𝛾̇) of 1 s-1 and a temperature equilibration time of 300 seconds. Shear rate was then incrementally increased from 1 – 1000 s-1 over 300 seconds (Up step) and subsequently decreased from 1000 – 1 s-1 over 300 seconds (Down step). The relationship between apparent viscosity (η, mPa.s) and shear stress (s, Pa) as a function of shear rate (both up and down steps) was analyzed. Flow behavior was assessed using the Herschel-Bulkley model, which provides a generalized description of non-Newtonian fluid behavior according to the following equation:
![]()
where, σ is shear stress (Pa), K is consistency factor, is shear rate (s-1), n is flow behavior index, is yield stress.
Thixotropic behavior was evaluated by quantifying the hysteresis loop area of thixotropy (HLA) between the ascending and descending shear rate curves. The HLA, which provides a measure of the extent of thixotropy, was calculated using Origin 2022 software (OriginLab Corporation, U.S.A.).18,19
Oscillatory measurement
The gelatinization and retrogradation properties of the starch samples were evaluated using temperature sweep (oscillatory) measurements, which assess the relationship between viscosity, storage modulus (G’), and loss modulus (G”) as a function of temperature.20 This technique simulates the conditions of a Rapid Visco Analyzer (RVA) test, providing insights into the changes in starch viscosity during heating.21 A 10% starch suspension (1 g starch in 10 mL distilled water) was analyzed using a HAAKE RheoStress 1 Rheometer (ThermoFisher Scientific, Germany) equipped with a PP35 parallel plate geometry (1 mm gap). The temperature sweep protocol consisted of five stages: (i) equilibration at 30°C for 60 s at a shear stress (s) of 1000 Pa and a frequency (f) of 1000 Hz; (ii) heating from 30 – 90°C over 3600 s at s = 200 Pa and f = 1000 Hz; (iii) holding at 90°C for 600 s at f = 1000 Hz and s = 200 Pa; (iv) cooling from 90 – 30°C over 3600 s at f = 1000 Hz and s = 200 Pa; and (v) equilibration at 30°C for 60 s at f = 1000 Hz and s = 200 Pa.
 |
Figure 1: RVA pasting profile or oscillatory (temperature sweep) profile.21 |
The thermal properties of starch are presented in Figure 1. Breakdown viscosity (BD) and setback viscosity (SB) are determined using the following formulas:
where, PV is peak viscosity (mPa); HS (holding strength) is break down viscosity (mPa); FV (final viscosity) is setback viscosity (mPa).
Statistical analysis
All measurements were performed in triplicate. The mean and standard deviation were calculated for each set of measurements. Statistical analysis was conducted using one-way analysis of variance (ANOVA) followed by Duncan’s multiple range test (p < 0.05) to determine significant differences between the means of the analyzed samples. Statistical analyses were performed using SPSS software (version 20, SPSS).
Results
Reducing power (RP) serves as an indicator of starch depolymerization. Table 1 reveals three main trends: (i) Gelatinization increased RP compared to raw starch, suggesting that depolymerization occurred during the gelatinization process (121°C for 15 minutes). (ii) RP increased with longer hydrolysis times in both hydrolysis-only and hydrolysis-retrogradation samples. (iii) Retrogradation decreased RP.
Table 1: Reducing power, apparent amylose and degree of relative crystallinity of starches.
|
Sample |
RP (mg/g) | AM (%) | DRC (%) |
| N | 3.79 ± 0.10 | 16.29 ± 0.65e |
67.57h |
|
A |
6.70 ± 0.14d | 11.29 ± 0.65d | – |
| H0 | 6.30 ± 0.26d | 11.01 ± 0.14d |
29.91c |
|
H4 |
7.38 ± 0.06e | 7.46 ± 0.54a | 20.34a |
| H10 | 7.46 ± 0.03e | 7.86 ± 0.14c |
30.91d |
|
H18 |
7.66 ± 0.07e | 8.19 ± 0.13c | 31.05e |
| HR0 | 4.26 ± 0.51ab | 8.07 ± 0.24c |
37.37h |
|
HR4 |
4.52 ± 0.07b | 7.21 ± 0.51a | 29.80b |
| HR10 | 4.66 ± 0.43bc | 7.69 ± 0.29b |
34.09f |
|
HR18 |
4.96 ± 0.03c | 8.10 ± 0.12c |
34.87g |
RP: Reducing power; AM: apparent amylose; DRC: degree of relative crystallinity; N: Raw starch; A: Gelatinized starch; H0, H4, H10, H18: acidic hydrolyzed starch by time (0, 4, 10 and 18 hours); HR0, HR4, HR10, HR18: acidic hydrolyzed starch by time and retrogradation
Data are presented as mean ± standard deviation (n=3). Different letters within a column indicate significant differences (p < 0.05).
Analysis of apparent amylose content (Table 1) revealed three key trends: (i) All modified starches exhibited lower apparent amylose content compared to the native starch (N). (ii) Within each retrogradation cycle, apparent amylose content increased with longer hydrolysis times, following the order H4 < H10 < H18 and HR4 < HR10 < HR18. (iii) For a given hydrolysis time, apparent amylose content decreased with increased retrogradation cycles: H0 > HR0, H4 > HR4, H10 > HR10, and H18 > HR18.
Consistent with previous findings of Trinh et al.,16, the native sweet potato starch (N) in this study exhibited a B-type X-ray diffraction pattern (Figure 2). Characteristic diffraction peaks were observed at approximately 15.05°, 17.14°, 22.32°, and 24.24° (2q), confirming the presence of a B-type crystalline structure.22 X-ray diffraction analysis (Figure 2) revealed a decrease in peak intensity for modified starches compared to the native starch and the degree of relative crystallinity (DRC) is quantified in Table 1.
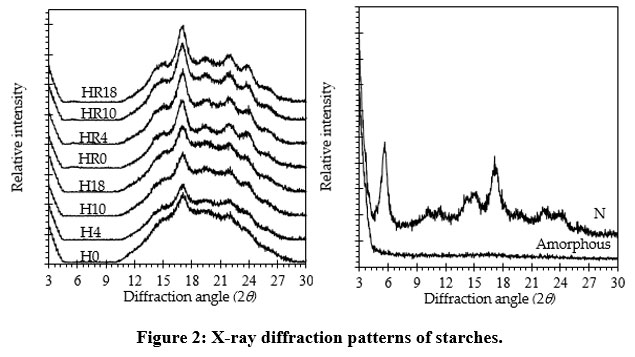 |
Figure 2: X-ray diffraction patterns of starches. |
The relationship between shear rate (Y), shear stress (σ), and apparent viscosity (h) was analyzed using the Herschel-Bulkley model, with the calculated parameters presented in Table 2. Yield stress exhibited a decreasing trend with increasing hydrolysis time, particularly during the initial 0-4 hours. At low shear rates (0 – 100 s-1), shear stress increased rapidly while apparent viscosity decreased sharply. Native starch (N) showed lower shear stress and viscosity compared to the HR0-HR18 samples. Furthermore, apparent viscosity tended to increase with longer hydrolysis times. Conversely, at high shear rates (800 – 1000 s-1), both shear stress and apparent viscosity remained relatively constant. All samples exhibited Herschel-Bulkley fluid behavior, characterized by a yield stress (σ0) >0, where viscosity decreased with increasing shear rate.
Table 2: Herchel-Bulkley model of samples and the hysteresis loop area of thixotropy
|
Sample |
k | n | R2 | Fluid behavior | HLA | |
|
Up-curves of the hysteresis loop: from 1 to 1000 s-1 |
||||||
| N | 2.672 | 0.555 | 14.901 | 0.997 | Herchel – Bulkley |
|
|
H0 |
54.736 | 0.295 | 15.960 | 0.999 | ||
| H4 | 45.693 | 0.295 | 15.633 |
0.976 |
||
|
H10 |
73.341 | 0.247 | 5.703 | 0.979 | ||
| H18 | 64.655 | 0.257 | 5.250 |
0.983 |
||
|
HR0 |
85.547 | 0.262 | 0.480 | 0.994 | ||
| HR4 | 3.814 | 0.573 | 0.496 |
0.999 |
||
|
HR10 |
26.150 | 0.343 | 0.485 | 0.995 | ||
| HR18 | 17.470 | 0.373 | 0.500 |
0.998 |
||
|
Down-curves of the hysteresis loop: from 1000 to 1 s-1 |
||||||
|
N |
1.438 | 0.653 | 10.370 | 0.999 | Herchel – Bulkley |
2481.4b |
| H0 | 8.024 | 0.560 | 9.977 | 0.965 |
78857.8h |
|
|
H4 |
3.530 | 0.645 | 35.732 | 0.998 | 64584.2e | |
| H10 | 8.918 | 0.540 | 5.687 | 0.996 |
73733.1g |
|
|
H18 |
9.008 | 0.530 | 6.619 | 0.996 | 69394.6f | |
| HR0 | 12.848 | 0.525 | 5.190 | 0.994 |
83828.5i |
|
|
HR4 |
2.377 | 0.626 | 4.270 | 0.999 | 1810.6a | |
| HR10 | 6.315 | 0.540 | 5.497 | 0.996 |
36361.4d |
|
|
HR18 |
2.674 | 0.627 | 7.517 | 0.999 |
22393.5c |
|
N: Raw starch; A: Gelatinized starch; H0, H4, H10, H18: acidic hydrolyzed starch by time (0, 4, 10 and 18 hours); HR0, HR4, HR10, HR18: acidic hydrolyzed starch by time and retrogradation; HLA: hysteresis loop area
Data are presented as mean (n=3). Different letters within a column indicate significant differences (p < 0.05)
As depicted in Figure 3, the native starch (N) exhibited the lowest maximum shear stress (smax) at a shear rate of 1000 s-1. The gelatinized starch (H0) showed a higher smax compared to the acid-hydrolyzed samples (H4, H10, and H18). Notably, smax for HR0 exceeded that of H0. In contrast, all retrograded samples (HR4, HR10, HR18) displayed lower smax values than their corresponding hydrolyzed counterparts (H4, H10, H18).
 |
Figure 3: Shear rate sweep test of samples. |
Oscillatory measurement
Table 3 presents the pasting parameters measured in this study, including pasting temperature (PT), peak viscosity (PV), peak temperature (Tpe), holding strength (HS), breakdown viscosity (BD), final viscosity (FV), and setback (SB).
Table 3: Pasting properties of starches from temperature sweep test
|
Sample |
PT
(°C) |
Tpe
(°C) |
PV
(mPa) |
HS
(mPa) |
BD
(mPa) |
FV
(mPa) |
SB
(mPa) |
| N | 83.47i | 89.50i | 2873.0b | 202.0f | 2671.0c | 163.8c |
-38.2a |
|
H0 |
60.74c | 87.47h | 180.5a | 147.2e | 33.3a | 209.2d | 62.0c |
| H4 | 58.73a | 75.76f | 24280.0h | 552.0h | 23728.0h | 687.1h |
135.1g |
|
H10 |
61.50d | 75.24e | 10050.0f | 349.5g | 9700.5f | 547.8g | 198.3h |
| H18 | 59.00b | 74.74c | 3491.0d | 106.5b | 3384.5d | 143.0b |
36.5b |
|
HR0 |
67.01h | 79.27g | 3201.0c | 628.0i | 2573.0b | 1024.0i | 396.0i |
| HR4 | 63.52e | 74.75d | 26280.0i | 144.1d | 26135.9i | 229.4f |
85.3e |
|
HR10 |
65.74g | 74.47b | 4659.0e | 74.3a | 4584.7e | 137.3a | 63.0d |
| HR18 | 65.00f | 74.26a | 19020.0g | 121.1c | 18898.9g | 212.5e |
91.4f |
The standard deviation (SD) < 0.05 is not displayed in the table. Values with different symbols in the same column indicate statistically significant differences (p<0.05).
PT (pasting temperature); Tpe (peak temperature); PV (peak viscosity); HS (holding strength); BD (breakdown viscosity); FV (final viscosity); SB (setback).
Discussions
Three main trends of reducing power (Table 1) can be explained as: (i) This aligns with previous findings that prolonged autoclaving of starch under high-moisture conditions can induce thermal degradation, leading to the depolymerization of starch molecules.23 (ii) longer hydrolysis times resulted in greater depolymerization and a higher number of reducing ends. This is consistent with the understanding that shorter starch chains exhibit increased solubility compared to longer chains.24 (iii) The reduction in reducing power is attributed to the formation of hydrogen bonds between starch molecules, particularly linear molecules, during retrogradation. These intermolecular interactions reduce the availability of reducing ends. Extended retrogradation periods promote increased hydrogen bond formation, further diminishing RP. Consequently, the average molecular weight of the starch increases, while the number of linear molecules and reducing ends decreases.25
The observed decrease in apparent amylose content (Table 1) in all modified starches compared to the native starch (trend i) can be attributed to the depolymerization of starch molecules during gelatinization. This process generates shorter chain lengths, potentially including dextrins with fewer than 8 glucose units, which do not produce a color reaction with iodine. Furthermore, centrifugation following hydrolysis resulted in the separation of a supernatant that exhibited a blue-violet color upon addition of iodine. This indicates the loss of iodine-reactive starch components, including amylose, amylopectin, and dextrins, during the centrifugation process.7,15
The observed increase in apparent amylose content with longer hydrolysis times (trend ii) can be attributed to the random cleavage of both α-1,4 and α-1,6 glycosidic bonds by acid hydrolysis. This cleavage leads to the formation of new starch chains, including linear fragments, which contribute to increased iodine binding capacity. It is important to note that samples H0 and HR0, which did not undergo acid hydrolysis, deviate from this trend. The analysis focuses specifically on samples H4, H10, H18 and HR4, HR10, HR18, which were subjected to varying hydrolysis durations. While longer hydrolysis times generally lead to higher apparent amylose content, the difference between 18-hour and 10-hour hydrolysis samples is less pronounced than that between 10-hour and 4-hour samples. This suggests that the rate of increase in apparent amylose content diminishes with extended hydrolysis, and excessively long hydrolysis times may even lead to a decrease due to the formation of short dextrins.
The observed reduction in apparent amylose content with retrogradation (trend iii) suggests that retrogradation promotes reassociation between starch chains, potentially through lateral associations rather than linear extensions. This reassociation may hinder iodine accessibility to interior segments of the starch chains, thereby reducing the measured amylose content. Additionally, retrogradation enhances the stability of crystalline regions within the starch granules, making them less susceptible to alkaline treatment (cold gelatinization) and subsequent ionization. This reduced ionization can impede the formation of the iodine-starch complex, further contributing to the observed changes in apparent amylose content in retrograded starches.26
Theoretically, type B starch (Figure 2) is more difficult to digest than A-type because the looser packing and higher water content in B-type crystals make them more resistant to enzyme breakdown.27 In addition, the strong bonding between OH groups in the crystalline structure makes the gelatinization process of B-type starch require a higher temperature.28
Comparison of the X-ray diffractograms of native and gelatinized (amorphous) starch revealed a loss of crystallinity upon gelatinization. The X-ray pattern of the gelatinized starch (A) exhibited no discernible peaks (Figure 2), indicating a negligible degree of crystallinity and a predominantly amorphous structure. This observation is consistent with the complete gelatinization of the starch sample. Gelatinization disrupts the ordered arrangement of starch molecules, causing a transition from a crystalline B-type pattern to an amorphous state. The loss of molecular order within the granules results in the disruption of the crystalline structure.7
X-ray diffraction analysis (Figure 2) revealed a decrease in peak intensity for modified starches compared to the native starch, indicating a reduction in crystallinity. The degree of relative crystallinity (DRC) is quantified in Table 1. Acid hydrolysis initially disrupts the crystalline and semi-crystalline structure of starch by cleaving glycosidic bonds and reducing the molecular weight of starch chains, as evidenced by the lower DRC of H4 compared to H0. However, prolonged hydrolysis promotes recrystallization, leading to an increase in DRC, as observed in samples H4, H10, and H18. This increase can be attributed to the reassembly of linear chains generated during depolymerization into new crystalline structures.29,30 Furthermore, the characteristic peak at 5.8°, associated with B-type crystallinity, disappeared in all hydrolyzed samples (H0, H4, H10, H18), indicating a partial loss of B-type crystalline structure following gelatinization and hydrolysis. Retrogradation significantly increased the DRC of all HRs samples compared to Hs samples (Table 1), suggesting that linear molecules reassociated to form a more extensive crystalline structure.7
The result of Table 2 show that the decrease in shear stress and apparent viscosity of starch gels with increasing acid hydrolysis time was attributed to the breakdown of starch molecules, particularly amylopectin. That led to reduce molecular weight, decrease chain entanglements, increase solubility, and potentialy changes in crystalline structure. These chemical changes weaken the gel network, making it less resistant to flow and deformation.31–33
The observed decrease in apparent viscosity with increasing shear rate (Figure 3) is a common phenomenon in polymer gels, including starch.34 The native starch exhibited lower apparent viscosity compared to the modified starches. This could be attributed to the higher amylose content in native starch, as demonstrated in our previous work. Amylose, with its predominantly linear structure, contributes less to viscosity compared to amylopectin, which has a complex branched structure. Under shear stress, the extensive branching of amylopectin leads to increased intermolecular interactions and resistance to flow, resulting in higher apparent viscosity. Additionally, retrograded starches, characterized by a higher density of hydrogen bonds, exhibited higher apparent viscosity compared to their non-retrograded counterparts.35
Starch paste exhibits thixotropy (Figure 3), a reversible decrease in viscosity under shear stress, which is attributed to its microstructure and is crucial in various applications, particularly in the food industry for achieving desirable texture and stability in products like sauces and fillings.36 Thixotropy is characterized by reduced internal friction upon shear-induced breakdown of the internal structure, followed by a slow recovery of original consistency at rest. Conversely, antithixotropy denotes a faster structural recovery than breakdown. The hysteresis loop test is commonly employed to assess thixotropy, with the loop area quantifying the energy dissipated during shearing. Higher thixotropy values, indicative of rheological instability, may suggest poorer stability under shear forces.18 As shown in Table 1, the hysteresis loop area of thixotropy (HAL) varied among the starch samples. Native starch (N) and HR4 exhibited significantly lower HAL values compared to the Hs and other HRs samples, indicating that higher HAL values correlate with reduced stability under shear.
Starch pasting (Table 3) is a gelatinization process induced by heating starch granules in an aqueous solution. Starch granules imbibe water and swell, leading to a loss of crystalline structure and the leaching of amylose and other components. This disruption results in the release of starch molecules into the solution, forming a viscous paste. Our study employed a temperature sweep test with shear to analyze this pasting phenomenon. Shear forces further disintegrate the granules, enhancing intermolecular interactions and increasing paste viscosity. Variations in pasting properties across genotypes are attributed to factors such as granule rigidity, amylose leaching, phosphate and lipid content, total amylose content, and starch granule crystallinity.37,38
The pasting temperature (PT) is the temperature at which starch granules begin to swell and lose their birefringence, signifying the onset of the pasting process. In Table 3, the PT of the native starch (N) is the highest, indicating a higher energy requirement for pasting. The PT shows a general decreasing trend from H0 to H18, with the exception of H10. This suggests that the hydrolysis decreases the thermal stability of the starch granules, making them more susceptible to swelling. The PT of the HR sample series follows a similar trend to the H sample series, with a decreasing trend from HR0 to HR18. This indicates that the retrogradation process does not significantly affect the PT of the starches.
The peak temperature (Tpe) is the temperature at which the starch paste reaches its maximum viscosity. The Tpe follows a similar trend to PT, decreasing from H0 to H18, with H10 showing a slight deviation. This indicates that the hydrolysis decreases the temperature at which maximum viscosity is reached during pasting. The Tpe of the HR sample series shows a consistent decreasing trend from HR0 to HR18, similar to the H sample series.
The peak viscosity (PV) is the maximum viscosity achieved during the pasting process. The PV shows a significant increase from H0 to H4, followed by a gradual decrease to H18. This suggests that the hydrolysis initially increases the swelling capacity of the starch granules, but prolonged treatment leads to a decrease in PV due to the breakdown of the starch molecules. The PV of the HR sample series follows a similar trend to the H sample series. with an initial increase from HR0 to HR4, followed by a decrease to HR18.
The holding strength (HS) is the ability of the starch paste to maintain its viscosity under shear stress. The HS follows a similar trend to PV, increasing from H0 to H4 and then decreasing to H18. This indicates that the hydrolysis initially increases the stability of the starch paste, but prolonged treatment leads to a decrease in HS due to the breakdown of the starch molecules. The HS of the HR sample series shows a decreasing trend from HR0 to HR18, with the exception of HR10. This suggests that the retrogradation process decreases the stability of the starch paste.
The breakdown viscosity (BD) is the loss of viscosity during the holding period at 95°C. The BD shows a similar trend to PV and HS, increasing from H0 to H4 and then decreasing to H18. This suggests that the hydrolysis initially increases the breakdown of the starch paste, but prolonged treatment leads to a decrease in BD due to the reduced viscosity of the paste. The BD of the HR sample series follows a similar trend to the H sample series, with an initial increase from HR0 to HR4, followed by a decrease to HR18.
The final viscosity (FV) is the viscosity of the paste after the holding period at 95°C. The FV shows a similar trend to PV, HS, and BD, increasing from H0 to H4 and then decreasing to H18. This indicates that the hydrolysis initially increases the FV, but prolonged treatment leads to a decrease in FV due to the breakdown of the starch molecules. The FV of the HR sample series follows a similar trend to the H sample series.
The setback viscosity (SB) is the increase in viscosity during the cooling stage from 95°C to 30°C. The SB shows a gradual increasing trend from H0 to H18, with the exception of H18. This suggests that the hydrolysis increases the tendency for retrogradation, leading to an increase in SB. The SB of the HR sample series shows a decreasing trend from HR0 to HR18, with the exception of HR10. This indicates that the retrogradation process decreases the tendency for further retrogradation during cooling.
Overall, the hydrolysis and retrogradation process have significant effects on the pasting properties of starches. The hydrolysis generally decreases the PT, Tpe, HS, and SB, while increasing the PV, BD, and FV. The retrogradation process generally decreases the PT, Tpe, HS, and SB, while increasing the PV, BD, and FV. These changes in pasting properties can be attributed to the alterations in the structure and properties of the starch molecules caused by the hydrolysis and retrogradation process.
Conclusions
This study presents innovative findings on the structural and rheological modifications of water yam starch using partial hydrolysis and retrogradation. The combination of these processes successfully tailored the starch’s physicochemical and functional properties, addressing limitations in conventional starch applications. Acid hydrolysis enhanced reducing power and promoted depolymerization, while retrogradation increased the degree of crystallinity and thermal stability. This dual-modification approach also improved the rheological profile, yielding thixotropic behavior advantageous for industrial applications requiring controlled viscosity. The innovation of this study lies in its demonstration of the synergistic effects of combining hydrolysis and retrogradation, achieving a balance between structural rearrangement and functional enhancement. These findings contribute to the development of advanced starch-based materials with potential applications in food, pharmaceuticals, and biodegradable packaging, highlighting water yam starch as a versatile and sustainable resource.
Acknowledgement
We sincerely acknowledge the technical assistance of Mr. Trong-Dat Vu (undegraduate student ID 19116165), and Mr. Trong-Khang Le (undergraduate student ID 19116179), Ms. Huong-Nguyen Tran (graduate student ID 2231203). These students have supported us with enthusiasm and responsibility thereby helping to keep the research on schedule. We are also grateful to Ho Chi Minh University of Technology and Education for providing the facilities for us to carry out this study.
Funding Sources
This work was funded by the Ministry of Education and Training of Vietnam, under grant No. B2024-SPK-03, and hosted by Ho Chi Minh City University of Technology and Education, Vietnam.
Conflict of Interest
The authors do not have any conflict of interest.
Data Availability Statement
Data will be made available on request.
Ethics Statement
This study did not involve human participants, animal subjects, and any material that requires ethical approval.
Informed Consent Statement
This study did not involve human participants, and therefore, informed consent was not required.
Cinical Trial Registration
This study did not involve clinical trial, and therefore, it is not registered in any Registry of Clinical Trials.
References
- Jiang S, Cen J, Zhou Y, et al. Physicochemical characterizations of five Dioscorea alata L. starches from China. Int J Biol Macromol. 2023;237. doi:10.1016/j.ijbiomac.2023.124225
CrossRef - Mweta DE, Labuschagne MT, Koen E, Benesi IRM, Saka JDK. Some properties of starches from cocoyam (Colocasia esculenta) and cassava (Manihot esculenta Crantz.) grown in Malawi. African Journal of Food Science. 2008;2(8):102-111.
- Li S, Sun C, Sun Y, Li E, Li P, Wang J. Acid Hydrolysis of Quinoa Starch to Stabilize High Internal Phase Emulsion Gels. Gels. 2024;10(9):559.
CrossRef - Duceac IA, Coseri S. Chitosan Schiff-Base hydrogels—A critical perspective review. Gels. 2022;8(12):779.
CrossRef - Ungureanu-Iuga M, Mironeasa S. Changes Induced by Heat Moisture Treatment in Wheat Flour and Pasta Rheological, Physical and Starch Digestibility Properties. Gels. 2023;9(6):449.
CrossRef - Le Thanh-Blicharz J, Lewandowicz J, Małyszek Z, Baranowska HM, Kowalczewski PŁ. Chemical modifications of normal and waxy potato starches affect functional properties of aerogels. Gels. 2022;8(11):720.
CrossRef - Cui SW. Food Carbohydrates: Chemistry, Physical Properties, and Applications. CRC press; 2005.
CrossRef - Hoover R. Composition, molecular structure, and physicochemical properties of tuber and root starches: A review. Carbohydr Polym. 2001;45(3). doi:10.1016/S0144-8617(00)00260-5
CrossRef - Eliasson AC. Carbohydrates in Food, Third Edition.; 2017. doi:10.1201/9781315372822
CrossRef - Lapasin R, Pricl S. Rheology of Industrial Polysaccharides: Theory and Applications.; 1995. doi:10.1007/978-1-4615-2185-3
CrossRef - Jayakody L, Hoover R. The effect of lintnerization on cereal starch granules. Food Research International. 2002;35(7):665-680.
CrossRef - Mun SH, Shin M. Mild hydrolysis of resistant starch from maize. Food Chem. 2006;96(1). doi:10.1016/j.foodchem.2005.02.015
CrossRef - Zhang Z, Zhao S, Xiong S. Morphology and physicochemical properties of mechanically activated rice starch. Carbohydr Polym. 2010;79(2):341-348.
CrossRef - Miller GL. Use of Dinitrosalicylic Acid Reagent for Determination of Reducing Sugar. Anal Chem. 1959;31(3). doi:10.1021/ac60147a030
CrossRef - Zhu T, Jackson DS, Wehling RL, Geera B. Comparison of amylose determination methods and the development of a dual wavelength iodine binding technique. Cereal Chem. 2008;85(1):51-58.
CrossRef - Trinh KS, Choi SJ, Moon TW. Structure and digestibility of debranched and hydrothermally treated water yam starch. Starch‐Stärke. 2013;65(7‐8):679-685.
CrossRef - Nara S, Komiya T. Studies on the relationship between water‐satured state and crystallinity by the diffraction method for moistened potato starch. Starch‐Stärke. 1983;35(12):407-410.
CrossRef - Krystyjan M, Sikora M, Adamczyk G, et al. Thixotropic properties of waxy potato starch depending on the degree of the granules pasting. Carbohydr Polym. 2016;141. doi:10.1016/j.carbpol.2015.12.063
CrossRef - Sikora M, Adamczyk G, Krystyjan M, et al. Thixotropic properties of normal potato starch depending on the degree of the granules pasting. Carbohydr Polym. 2015;121. doi:10.1016/j.carbpol.2014.12.059
CrossRef - Montes L, Rosell CM, Moreira R. Rheological Properties of Corn Starch Gels With the Addition of Hydroxypropyl Methylcellulose of Different Viscosities. Front Nutr. 2022;9. doi:10.3389/fnut.2022.866789
CrossRef - Karim AA, Norziah MH, Seow CC. Methods for the study of starch retrogradation. Food Chem. 2000;71(1). doi:10.1016/S0308-8146(00)00130-8
CrossRef - Imberty A, Buléon A, Tran V, Péerez S. Recent advances in knowledge of starch structure. Starch‐Stärke. 1991;43(10):375-384.
CrossRef - zhu Zheng M, Xiao Y, Yang S, et al. Effects of heat–moisture, autoclaving, and microwave treatments on physicochemical properties of proso millet starch. Food Sci Nutr. 2020;8(2). doi:10.1002/fsn3.1295
CrossRef - Richardson WA, Higginbotham RS, Farrow FD. The Reducing Power and Average Molecular Chain-Length of Starch and Its Hydrolysis Products, and the Constitution of Their Aqueous Pastes. Textile Research Journal. 1936;6(9). doi:10.1177/004051753600600903
CrossRef - Hizukuri S. Relationship between the distribution of the chain length of amylopectin and the crystalline structure of starch granules. Carbohydr Res. 1985;141(2):295-306.
CrossRef - Apostolidis E, Kwon YI, Shetty K. Inhibitory potential of herb, fruit, and fungal-enriched cheese against key enzymes linked to type 2 diabetes and hypertension. Innovative Food Science and Emerging Technologies. 2007;8(1). doi:10.1016/j.ifset.2006.06.001
CrossRef - Martens BMJ, Gerrits WJJ, Bruininx EMAM, Schols HA. Amylopectin structure and crystallinity explains variation in digestion kinetics of starches across botanic sources in an in vitro pig model. J Anim Sci Biotechnol. 2018;9(1):91. doi:10.1186/s40104-018-0303-8
CrossRef - Cornejo-Ramírez YI, Martínez-Cruz O, Del Toro-Sánchez CL, Wong-Corral FJ, Borboa-Flores J, Cinco-Moroyoqui FJ. The structural characteristics of starches and their functional properties. CyTA – Journal of Food. 2018;16(1):1003-1017. doi:10.1080/19476337.2018.1518343
CrossRef - Kong X, Kasapis S, Bertoft E, Corke H. Rheological properties of starches from grain amaranth and their relationship to starch structure. Starch/Staerke. 2010;62(6). doi:10.1002/star.200900235
CrossRef - Trinh KS, Le HL. Changes in structural, physicochemical properties and digestibility of partial hydrolyzed and annealed maize starch. International Journal of Advanced and Applied Sciences. 2022;9(3). doi:10.21833/IJAAS.2022.03.010
CrossRef - Wang S, Copeland L. Effect of acid hydrolysis on starch structure and functionality: a review. Crit Rev Food Sci Nutr. 2015;55(8):1081-1097.
CrossRef - Li L, Hong Y, Gu Z, Cheng L, Li Z, Li C. Effect of a dual modification by hydroxypropylation and acid hydrolysis on the structure and rheological properties of potato starch. Food Hydrocoll. 2018;77:825-833. doi:https://doi.org/10.1016/j.foodhyd.2017.11.026
CrossRef - Utrilla-Coello RG, Hernández-Jaimes C, Carrillo-Navas H, et al. Acid hydrolysis of native corn starch: Morphology, crystallinity, rheological and thermal properties. Carbohydr Polym. 2014;103:596-602. doi:https://doi.org/10.1016/j.carbpol.2014.01.046
CrossRef - Chakraborty I, Govindaraju I, Kunnel S, Managuli V, Mazumder N. Effect of Storage Time and Temperature on Digestibility, Thermal, and Rheological Properties of Retrograded Rice. Gels. 2023;9(2). doi:10.3390/gels9020142
CrossRef - Chanvrier H, Uthayakumaran S, Appelqvist IAM, Gidley MJ, Gilbert EP, López-Rubio A. Influence of storage conditions on the structure, thermal behavior, and formation of enzyme-resistant starch in extruded starches. J Agric Food Chem. 2007;55(24). doi:10.1021/jf071974e
CrossRef - Steffe JF. Rheological Methods in Food Engineering Process.; 1996.
- Balet S, Guelpa A, Fox G, Manley M. Rapid Visco Analyser (RVA) as a Tool for Measuring Starch-Related Physiochemical Properties in Cereals: a Review. Food Anal Methods. 2019;12(10). doi:10.1007/s12161-019-01581-w
CrossRef - Corke H, Wu H, Yue S, Sun H. Developing specialty starches from new crops: a case study using grain amaranth. Cereals: Novel uses and processes. Published online 1997:91-102.
CrossRef

This work is licensed under a Creative Commons Attribution 4.0 International License.


