
Introduction
Asia has one of the highest prevalence rates of type 2 diabetes mellitus (T2DM) and accounts for 60% of the world’s diabetes population according to International Diabetes Federation report.1 Asian phenotype has been shown to be most susceptible to diabetes than Caucasians.2 In Malaysia, T2DM is prevalent in 18.3% of the adult population, over doubled since 1996.3 Currently, in Malaysia diabetes is predominant in 31.4% of Indians compared to other ethnicities.3 Environmental and lifestyle changes have been popular causes of diabetes; however, strong evidence reported that Indians have a greater degree of obesity, insulin resistance and a higher genetic tendency to diabetes, making them more susceptible to the disease.4 The transition from prediabetes to diabetes is also more dramatic and severe among Asians thus, the research on its prevention and management is increasingly important.4
Snacks consumption can contribute significantly to the daily energy and nutrient intakes.5 Increment in blood glucose levels with snacking has been associated with increased risk of diabetes and obesity.5 The selection of an appropriate snack may pose a challenge, but recent studies showed that snacks with low glycaemic index (GI) and glycaemic load (GL) were beneficial in reducing postprandial glycaemic response (PPGR) not only in healthy individuals,6-7 but also in people that have diabetes.8 In addition, differences in the nutrient composition of a snack may impact glucose metabolism regulation that contributes to anti-diabetic effect. Several previous evidence presented benefits on PPGR and markers of glycaemic control with consumption of snacks high in dietary fibre, protein and low in GI.7-8
Generally, vegetables, fruits, and pulses have a low-GI, while starch and carbohydrate-rich foods typically have high GI.9 Pulses invariably have a low to medium GI, which translates into the benefits against chronic diseases; evidence is strong for the specific inclusion of pulses in the diet and reduction of diabetes risk.8 Pulses defined as “annual leguminous crops”, in the legume family, have always been an important part of the Indian cuisines.10 Pulses are nutrient-rich and have a high content of plant protein, calories, dietary fibre, slow-release carbohydrates, a wide range of minerals, and phytochemicals such as carotenoids and polyphenols.8,10 They promote health by reducing insulin resistance,11 aid in weight management,12 and extend benefit of prevention of cardiovascular disease.13
The Masala Vadai (MS) and Medu Vadai (MD) are traditional Indian snacks made from two varieties of pulses. MS is prepared using Bengal gram (channa dhal), while MD is prepared using the black gram (urad dhal). The processing of MS and MD differs, where Bengal gram for MS is blended partially to give a coarse texture while, black gram for MD is blended to a smooth texture. Both snacks have somewhat similar spices and are deep-fried with differing carbohydrate, protein, and dietary fibre content. The nutrient content of pulses used to prepare these snacks is presented in Table 1.
Table 1: Nutrient content of pulses (boiled without salt) (g/100 g) USDA 2019
|
|
Bengal gram (Masala Vadai) | Black gram (Medu Vadai) |
|
Total weight (g) |
100 | 100 |
| Carbohydrate (g) | 62.95 |
58.99 |
|
Protein (g) |
20.47 | 25.21 |
| Fat (g) | 6.04 |
1.64 |
| Dietary fibre (g) | 12.20 |
18.30 |
Based on USDA 2019.10
Selecting a healthy snack may assist in the control on PPGR levels. While the MS and MD are popular Malaysian traditional snacks, their GI and GL properties, and impact on PPGR remain unexplored. Moreover, this study is novel in that it compares the effects of two distinct pulse types on GI and PPGR in healthy Indian volunteers. This study findings will offer evidence on health benefits of traditional snacks made from pulses, and the GI and GL values of these snacks would be an addition to the GI database/compendium of Asian foods.11 The health benefits of these snacks must be established before recommendations are given to the public.
Materials and methods
Study participants
Healthy volunteers of Indian ethnicity, aged between 19-30 years, were invited to participate in this study. Participants were recruited through promotional flyers, word of mouth and online advertisements. Prior to the study recruitment, all volunteers were screened for any abnormal health behaviour. The screening included anthropometric assessment (weight and height), finger prick fasting blood glucose analysis and a general questionnaire used to assess health. Recruited participants had normal body mass index (18.5-24.9 kg/m2), no history of smoking and fasting blood glucose levels <7 mmol/L. They should be healthy and free from diseases, such as all forms of diabetes, cardiovascular diseases, eating disorders, gastrointestinal disorders, and depression. Participants were excluded if they took glycaemic-affecting drugs, such as thyroid hormones, thiazide diuretics, metformin, or glucocorticoids, or if they had test foods allergy. Volunteers diagnosed with polycystic ovary syndrome, actively engaged in competitive or endurance sports, were pregnant or nursing, or intentionally restricted their food intake were also excluded. A total of 15 participants were screened and recruited. Two participants dropped out after one session, resulting in the analysis of 13 data sets. A crossover design of 10 participants was needed for precision involving glycaemic response analysis in human subjects to detect 80% power and 0.05 significance.14
This investigation was carried out at the International Medical University, Kuala Lumpur, Malaysia. Ethics from the institutional committee was obtained and granted identification number of BDN I-2022 (01). Eligible participants provided written informed consent in compliance with the Declaration of Helsinki.
Study design and randomisation
There were three feeding sessions in this randomised, crossover, non-blinded study (i.e., either MS or MD or glucose solution as reference food (RF)) separated by a week of wash out period. Using a computer-generated randomiser,15 participants were assigned randomly to one of the test meal sequence combinations. The test meals sequence combination was concealed in an envelope, where revelation to the researcher and participant was made during the first feeding session.
Preparation of test meals
On the test days, every test meal was freshly prepared in the morning. The preparation for MS and MD begun by soaking 38g of Bengal gram and 26 g of black gram for 8 hours in the water, respectively until the grams soften for grinding. The Bengal gram was blended with 2 tablespoons of water until medium coarse texture was achieved with no visibility of whole gram, while the black gram was fully blended into a smooth and fine texture. In addition, the batter for MD was beaten using a spoon for 5 minutes until it was fluffy and thick. Other ingredients such as finely chopped onions (15 g), green chilli (4 g), ginger (1/2 inch), salt (1/2 tsp), pepper (1/2 tsp) and curry leaves (5 – 6 leaves), were added into both the Bengal gram and black gram batter and mixed well. The MS was moulded into a patty-like shape, while the MD was moulded into a doughnut-like shape before deep-frying in the heated oil until golden brown. Participants were served with two servings of MS (90 g) and MD (68g) each containing 12.5g of available carbohydrates, that could be consumed easily within 10 minutes.
Glucose solution was used as the reference food. It was formulated by dissolving 14 g of Dextrose Monohydrate (Glucolin, Reckitt Benckiser) in 200 ml of plain water. Detailed nutrition information of pulses used as test meals is summarised in Table 1.10
Procedures for determining the GI of the test meals
After 10 hours of fasting the night before, participants arrived at the lab between 8:00–9:00 a.m. Throughout the study period, they were instructed to maintain consistent eating and physical activity routines. They were asked to abstain from caffeine and alcohol and avoid strenuous exercise the night before and the morning of the experiment. If any volunteers reported feeling ill or had not followed the test conditions, the experiment was interrupted and rescheduled. Their body weight was measured at the first session of the experiment. After a 10-minute rest, baseline capillary blood samples via finger-prick were collected at the start of each feeding session. The test meals were made fresh that morning and were served after a minute in the microwave. Participants were required to consume the test meals and or glucose solution within 10 minutes, followed by 200 ml of plain water. Capillary blood glucose levels were recorded at 15-, 30-, 45-, 60-, 90-, and 120-minutes after meals ingestion. Participants consumed reference food (Dextrose Monohydrate), and the two test meals i.e., MS and MD, in a random order, with a minimum of one week’s separation between test and reference foods to reduce the carry-over effect.16 The reference food and test meals had 12.5 g of available carbohydrates so that portion sizes of the test meals could be comfortably consumed within 10 minutes. The overview of study flow and visits is summerised in Figure 1.
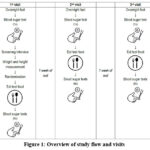 |
Figure 1: Overview of study flow and visits |
Measurement of blood glucose
A single-use lancing device (On Call Sterile Lancet, ACON Laboratories Inc., USA) was used for the finger-pricks and blood samples were collected on blood glucose test strip (GlucoSure AutoCode Blood Glucose Test Strips Apex Biotechnology Corp., Taiwan) following World Health Organisation (WHO) guidelines.17 Blood glucose concentration was measured using a glucometer (GlucoSure AutoCode Blood Glucose Monitoring System, Apex Biotechnology Corp., Taiwan).
Anthropometric measurement
Participants’ weight was measured using a digital weighing scale (TANITA digital scale HD-325, TANITA Health Equipment HK Ltd, Hong Kong), while their height was measured using a collapsible stadiometer (213 portable stadiometer, SECA, Germany), following the standard protocol. An average of two measures were taken and reported to the nearest 0.1 kg and 0.1 cm, respectively. Their weight (kg)/height (m2) was used to calculate body mass index (BMI).3
Determination of GI and GL
The incremental area under the PPGR curve (iAUC) was plotted using Microsoft Excel spreadsheet, following the trapezoidal rule.18 Each participant’s iAUC for each test meal was expressed as a percentage of the mean iAUC for the reference food they had eaten, as follows: GI = (iAUC for the test food containing 12.5g of available carbohydrate/iAUC of a reference food with an equal available carbohydrate portion) ×100. Every food that was tested had its GI determined from an average value across all the participants.18 The following formula was used to compute GL: GL = (GI of test food × available carbohydrate in a serving of test food (g))/100.18
Participants’ sensory evaluation
Participants were asked to evaluate test meals acceptance using a self-administered 9-point hedonic sensory scale.19 This sensory evaluation was to gauge participants compliance towards the test products; hence, expert evaluation was not required. The components domains assessed were appearance, taste, texture, aroma, and overall acceptability of the test meals.
Statistical analysis
Data was analysed using IBM SPSS version 28.0 for Windows.20 Participants characteristics and sensory evaluation were described as mean ± standard deviation (SD) for each group. For sensory evaluation, the data was presented as an average of a total of the 9 scores. Glucose concentrations at time intervals of interest were described as mean ± standard error of mean (SEM) for each group. The between-group effects of test meals on postprandial glycaemic excursion (glucose concentrations at time intervals, glucose peak, incremental glucose peak and glucose iAUC at 120 min) were analysed using One-Way ANOVA test followed by Bonferroni’s post-hoc tests for multiple comparison. Statistical significance was set at p<0.05.
Results
Participants characteristics
A total of 15 participants were recruited, with only 13 completing the study. Two participants dropped out after one session due to their inability to commit to the study schedule. Table 2 summarises participants characteristics who completed the study. The participants (5 males and 8 females) had a mean age of 20±2 years, normal BMI of 22.3±2.3 kg/m2 and normal fasting blood glucose of 5.2±0.5 mmol/L.
Table 2. Participants characteristics (n=13)
|
Variables |
Mean ± SD |
| Age (years) |
20 ± 2 |
|
Weight (kg) |
59.8 ± 7.8 |
|
Height (cm) |
164.0 ± 8.9 |
| BMI (kg/m2) |
22.3 ± 2.3 |
|
Fasting blood glucose (mmol/L) |
5.2 ± 0.5 |
Abbreviation: BMI= Body mass index, SD=standard deviation
All results are presented as mean± standard deviation.
Glycaemic response and glycaemic excursion of pulse-based traditional snacks
Figure 2 shows PPGR of test meals and RF. There was a significant difference in blood glucose concentration between the test meals and glucose solution at 15-minutes (MD: 5.5±0.1 mmol/L vs. MS: 5.5±0.1 mmol/L vs. RF: 6.2±0.3 mmol/L, p=0.013), 30-minutes (MD: 6.0±0.1 mmol/L vs. MS: 6.4±0.2 mmol/L vs. RF: 7.2±0.4 mmol/L, p=0.015) and 45-minutes (MD: 5.9±0.1 mmol/L vs. MS: 6.5±0.2 mmol/L vs. RF: 7.2±0.3 mmol/L, p=0.001). However, pairwise multiple comparisons showed that MD but not MS had a more supressed blood glucose concentration in comparison to glucose solution at 30-minutes (p<0.013) and 45-minutes (p<0.001) indicated by superscripts in Figure 2.
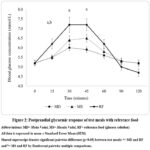 |
Figure 2. Postprandial glycaemic response of test meals with reference food |
Abbreviations: MD= Medu Vadai, MS= Masala Vadai, RF= reference food (glucose solution)
All data is expressed in mean ± Standard Error Mean (SEM)
Shared superscript denotes significant pairwise difference (p<0.05) between test meals: a= MD and RF and b= MS and RF by Bonferroni pairwise multiple comparisons.
Table 3 shows the pairwise comparisons and between-group effect of glycaemic excursions. Both the pulse-based snacks had a significantly lower peak blood glucose concentration (MD: 6.2±0.1 mmol/L vs. MS: 6.8±0.2 mmol/L vs. RF: 7.8±0.3 mmol/L, p<0.001) and incremental glucose peak (MD: 1.0±0.2 mmol/L vs. MS: 1.5±0.2 mmol/L vs. RF: 2.5±0.3 mmol/L, p<0.001) when compared to the reference food. However, MD exhibited a more suppressed effect compared to MS. Additionally, MD but not MS had significantly lower blood glucose iAUC (MD: 47.4±9.0 mmol/L x min vs. MS: 64.2±14.4 mmol/L x min vs. RF: 99.8±15.4 mmol/L x min, p=0.024). Nonetheless, there was no significant difference between the test meals and reference food on time to peak blood glucose (MD: 33.5±2.5 min vs. MS: 34.6±2.6 min vs. RF: 35.8±2.7 min, p=0.823).
Table 3: Glycaemic excursions of test meals and glucose solution by pairwise comparisons
|
|
MD | MS | RF | P-values |
|
Peak blood glucose (mmol/L) |
6.2 ± 0.1a
|
6.8 ± 0.2b | 7.8 ± 0.3a,b |
<0.001* |
| Time to peak blood glucose (minutes) | 33.5 ± 2.5 | 34.6 ± 2.6 | 35.8 ± 2.7 |
0.823 |
|
Incremental glucose peak (mmol/L) |
1.0 ± 0.2a | 1.5 ± 0.2b | 2.5 ± 0.3 a,b |
<0.001* |
|
iAUC (mmol/L x min) |
47.2 ± 9.0a | 64.2 ± 14.4 | 99.8 ± 15.4a |
0.024* |
Abbreviations: MD= Medu Vadai, MS= Masala Vadai, RF= reference food (glucose solution), iAUC= incremental area under the curve for blood glucose
All data is expressed in mean ± Standard Error Mean (SEM).
Shared superscript denotes significant by Bonferroni pairwise difference (p<0.05) between test meals: a= MD and RF and b= MS and RF.
Glycaemic index and glycaemic load of the test meals
GI and GL values of the test meals are presented in Table 4. The MD had a low GI value of 47 while the MS had a medium GI rating of 64. Nevertheless, both the pulse-based snacks had low GL values of 6 and 8, respectively.
Table 4: Glycaemic index and glycaemic load of test meals
|
Test meals |
Available carbohydrate (g) | Portion size (g) | GI values | GI classification | GL values | GL classification | |
|
MD |
12.5 | 68 | 47 | Low | 6 |
Low |
|
| MS | 12.5 | 90 | 64 | Medium | 8 |
Low |
|
Abbreviations: MD= Medu Vadai, MS= Masala Vadai, GI= glycaemic index, GL=glycaemic load
Participants’ sensory evaluation
Study participants expressed favourable reception for both MD and MS for their appearance (MD: 7.7±1.3 vs. MS: 8.0±0.9), taste (MD: 8.0±0.9 vs. MS: 8.2±0.9), texture (MD: 8.2±0.8 vs. MS: 8.4±0.9 ), aroma (MD: 8.2±0.8 vs. MS: 8.2±1.2) and overall acceptance (MD: 8.2±0.6 vs. MS: (8.5±0.8).
Discussion
To our knowledge, this is the first study to examine the GI characteristics of two Indian traditional pulse-based snacks consumed popularly by Malaysians and their effects on PPGR. Our findings revealed that MD had a low GI while MS had a medium GI. Consequently, MD had a more suppressed effect on glycaemic control than MS when compared to RF.
Postprandial glycaemic control plays a crucial role in preventing chronic diseases such as obesity, type 2 diabetes, and cardiovascular disease in both normoglycaemic and individuals with diabetes.21 An inverse association between pulse intake and incidence of type 2 diabetes was shown in several epidemiological studies.22,23 Additionally, clinical trials suggest that pulses when incorporated into long-term eating patterns may lower fasting blood glucose, HbA1c and insulin levels and also improve PPGR.24 The possible modifiers to impact PPGR in acute RCTs include the pulse types and their nutrient content, processing of the pulses, and cooking method that consequently impacts their GI properties.
The PPGR-lowering property of pulses has been attributed to the presence of higher amounts of resistant starch, protein, dietary fibre, and phenolic compounds which delay gastric emptying.25 The MD and MS in this study were prepared using black gram and Bengal gram, respectively. When compared to Bengal gram, black gram had higher protein and dietary fibre,10 which resulted in MD having a more subdued glycaemic response than MS in comparison to glucose solution. A protein-starch interaction in pulses may prevent digestive enzymes from gaining access to starch, lowering the quantity of glucose that can be absorbed through the intestines. Furthermore, a recent meta-analysis analysing the impact of dietary fibre of pulses (i.e., lentils) on blood glucose produced varying results.26 According to this review, foods high in soluble viscous fibre considerably lowered blood sugar and insulin levels in relation to their viscosity, while less viscous soluble fibres had no impact.26 The higher amount of soluble viscous dietary fibre that is usually present in pulses, explains the lower glycaemic excursions of both MD and MS in this study.27 In pulses, the quick fermenting fibre results in a quick release of phenolics. These polyphenols inhibit α-glucosidase and α-amylase, enzymes that digest dietary carbohydrates to glucose.27 Pulses also tend to have higher resistant starch than cereal and tuber crops.28 Starch can be categorised as rapidly digestible, slowly digestible or resistant, based on how easily it is broken down in the gut.28 The presence of thick cell walls provides protective effect for resistant starch, thus, limiting the accessibility of digestive enzymes, and resulting in a lower PPGR.28 α-glucosidases cannot act on this fraction of starch, and it remains undigested until it reaches the colon.28 This enzyme does not readily digest resistant starch due to its starch-protein matrix.28 Resistant starch’s slow-releasing nature reduces blood glucose spikes compared to digestible carbohydrates, reducing the incidence of insulin sensing dysfunction (the main cause of type 2 diabetes) and improving insulin sensitivity.28 These mechanisms are likely to confirm the findings obtained in this study.
Interestingly, our study finding revealed that the fully blended black gram and not the partially blended Bengal gram, used in the preparation of MD and MS, respectively produced a more suppressed PPGR, blood glucose iAUC, peak blood glucose and incremental peak blood glucose. Studies investigating the effect of pulses undergoing processing such as blending, milling, heating, boiling, and drying produced varying results.24,29 Most studies reported that the processing of pulses can reduce blood glucose when compared to control treatments.24,29 For instance, when boiled lentils or boiled lentils combined into a paste were consumed, the blood glucose responses were not as high as when white bread was consumed, but they were considerably higher when the boiled and blended lentils were dried at 250°F and ground into flour.29 Conversely, a study that used navy beans, green lentils, and chickpeas at 25 grams of available carbohydrate (~1 cup) and served with tomato sauce evaluated the acute effects of powdered, pureed, and whole canned pulses on PPGR.30 The study concluded that processing of pulses does not lead to loss their PPGR-lowering property because all of the pulses had similar low PPGR.30 Generally, pulses processed by blending or milling, may have their cell walls broken, exposing more starch to digestive enzymes; in contrast, pureeing or partially blending may cause the cells to separate, leaving them intact.24 However, further research is necessary to examine the impact of food processing on PPGR, given the high levels of heterogeneity within subgroups, the existence of distinct pulse types, and the absence of a standardised protocol for food processing in certain RCTs that were included in meta-analyses.
MD had a low GI while MS had a medium GI. However, both snacks were classified as low GL. Since GI values are dependent on food’s glycaemic response, it can be used to optimise PPGR. Post-meal blood glucose is reduced when a comparable amount of a high-GI food is substituted with a lower- or medium-GI option.7-8 This study found that eating a lower GI snack led to better glycaemic excursion than eating a snack with medium GI regardless of the GL value. Our findings were supported by another study that tested the effect of two low-GI biscuits with differing GI values on PPGR.6 Biscuit with lower GI value of 24 had a more supressed PPGR compared to the biscuit with GI value of 54. Therefore, the current study concludes that the GI value matters in influencing PPGR even within the low-medium GI range.6 Additionally, the acceptance of both MD and MS was well over 80-90% in this study. Pulses are nutrient-rich ingredients. Acceptability of these foods is important for regular consumers as well clinical trial participants, as it offers them health benefits.25-26,28 Generally, studies have reported that pulses are well-received food eaten either alone or mixed with meals and are a crucial part of the diet, especially for Indians.10,24
Our study strengths included the randomised, cross-over design, testing of novel snacks popularly consumed by Indians in Malaysia and the absence of the carry forward effect of the test meals. However, in the current study, we did not include participants from other ethnicities, hyperglycaemia or diabetes that may have a varied response to PPGR. Therefore, there is merit in exploring the effect of pulse-based snacks intake on PPGR in these populations in the future. We also did not include biochemical indices of satiety and appetite such as ghrelin and leptin to assess acceptability of the snacks. Notwithstanding these limitations, the research contributes to an expanding body of knowledge adding to the GI compendium/database of Asian foods and supporting the positive effect of pulse-based snacks consumption on PPGR.
Conclusion
This study concludes that the pulse-based snacks had better glycaemic excursion when compared to glucose solution. It is also evidenced that GI values within the low to medium range, have an impact on postprandial glycaemic response. MD with lower GI had a more supressed glycaemic excursion when compared to MS with medium GI. Healthcare professionals can now provide appropriate dietary advice and help individuals at risk improve their health and better control their blood glucose levels.
Acknowledgement
We thank the participants, researchers, and funders of this study.
Funding source statement
This work is supported by International Medical University under short-term grant: BDN I-2022 (01).
Conflict of Interest
The author(s) declares no conflict of interest.
Authors contribution
All authors provided substantial contribution to the conception and design of the study and approved the final manuscript. LWX and WJY were involved in data collection. HKGS, LWX, WJY, WCSS and SM were involved in data analysis and interpretation. HKGS drafted the manuscript and HKGS, WCSS and SM edited the final manuscript. All authors critically reviewed the manuscript for important intellectual content. All authors have read and agreed to the published version of the manuscript.
Data availability statement
The manuscript incorporates all datasets produced or examined throughout this research study.
Ethics approval statement
The document accurately and thoroughly presents the authors’ original research and analysis.
Informed consent statement
Informed consent was obtained for experimentation from the study participants prior to study commencements and it conforms to the standards currently applied in Malaysia.
References
- International Diabetes Federation. IDF diabetes atlas. 10th edition. Brussels, Belgium: International Diabetes Federation; 2021. https://diabetesatlas.org/. Accessed March 9, 2023.
- Ma R.C., Chan J.C. Type 2 diabetes in East Asians: similarities and differences with populations in Europe and the United States. Ann N Y Acad Sci. 2013;1281(1):64-91. DOI: 10.1111/nyas.12098.
CrossRef - Institute for Public Health. National Health and Morbidity Survey (NHMS) 2019: Vol. I: NCDs – Non-Communicable Diseases: risk factors and other health problems. National Institutes of Health: Ministry of Health Malaysia; 2020. https://iku.moh.gov.my/nhms-2019. Accessed March 9, 2023.
- Mohan V. Why are Indians more prone to diabetes? J Assoc Physicians India. 2004; 52:468-74.
- Howarth L., Petrisko Y., Furchner-Evanson A., Nemoseck T., Kern M. Snack selection influences nutrient intake, triglycerides, and bowel habits of adult women: A pilot study. J Am Diet Assoc.2010; 110:1322–1327. DOI: 10.1016/j.jada.2010.06.002.
CrossRef - Kaur B., Koh M., Ponnalagu S., Henry C.J. Postprandial blood glucose response: does the glycaemic index (GI) value matter even in the low GI range? Nutr Diabetes. 2020;10(1):15. DOI: 10.1038/s41387-020-0118-5.
CrossRef - Kim H.K., Nanba T., Ozaki M., Chijiki H., Takahashi M., Fukazawa M., Okubo J., Shibata S. Effect of the intake of a snack containing dietary fibre on postprandial glucose levels. 2020; 9(10):1500. DOI: 10.3390/foods9101500.
CrossRef - Bielefeld D., Grafenauer S., Rangan A. The effects of legume consumption on markers of glycaemic control in individuals with and without diabetes mellitus: a systematic literature review of randomised controlled trials. 2020; 12(7):2123. DOI: 10.3390/nu12072123.
CrossRef - Henry C.J., Quek R.Y.C., Kaur B., Shyam S., Singh H.K.G. A glycaemic index compendium of non-western foods. Nutr Diabetes. 2021; 11(1):2. DOI:10.1038/s41387-020-00145-w.
CrossRef - Singh M., Manickavasagan A., Shobana S., Mohan V. Glycemic index of pulses and pulse-based products: a review. Crit Rev Food Sci Nutr. 2021; 61(9):1567-1588. DOI: 10.1080/10408398.2020.1762162.
CrossRef - Cuvelier K., Storsley J., Mollard R., Thandapilly S., Ames N. A review of the impact of whole pulses on glycemic response. Cereal Foods World. 2017; 62:58. DOI: 10.1094/CFW-62-2-0053.
CrossRef - Kim S.J., de Souza R.J., Choo V.L., Ha V., Cozma A.I., Chiavaroli L., Mirrahimi A., Blanco Mejia S., Di Buono M., Bernstein A.M., Leiter L.A., Kris-Etherton P.M., Vuksan V., Beyene J., Kendall C.W., Jenkins D.J., Sievenpiper J.L. Effects of dietary pulse consumption on body weight: a systematic review and meta-analysis of randomised controlled trials. Am J Clin Nutr. 2016; 103(5):1213-23. DOI: 10.3945/ajcn.115.124677.
CrossRef - Anderson J., Major A. Pulses and lipaemia, short- and long-term effect: potential in the prevention of cardiovascular disease. Br J Nutr. 2002; 88(S3):263-271. DOI: 10.1079/BJN2002716.
CrossRef - Brouns F., Bjorck I., Frayn K.N., Gibbs A.L., Lang V., Slama G., Wolever T.M. Glycaemic index methodology. Nutr Res Rev. 2005;18(1):145-71. DOI: 10.1079/NRR2005100.
CrossRef - Saghaei M. Random allocation software for parallel group randomised trials. BMC Med Res Methodol. 2004; 4:26. DOI:10.1186/1471-2288-4-26.
CrossRef - ISO 26642. Food Products—Determination of the Glycaemic Index (GI) Recommendation for Food Classification. Geneva, Switzerland: ISO (International Standards Organisation; 2010. https://www.iso.org/standard/43633.html. Accessed March 9, 2023.
- World Health Organisation. 7, Capillary sampling. In: WHO Guidelines on Drawing Blood: Best Practices in Phlebotomy. Geneva: World Health Organisation; 2010. https://www.ncbi.nlm.nih.gov/books/NBK138644/. Accessed June 23, 2023.
- Food and Agriculture Organisation (FAO) and World Health Organisation (WHO). Carbohydrates in Human Nutrition. Report of a Joint FAO/WHO Expert Consultation. FAO Food and Nutrition Paper no. 66. Rome: FAO; 1998. https://www.fao.org/3/w8079e/w8079e00.htm. Accessed June 23, 2023.
- Lawless H.T., Heymann H. Sensory Evaluation of Food: Principles and Practices. 2nd edition. New York (US): Springer;2010. https://link.springer.com/book/10.1007/978-1-4419-6488-5. Accessed March 9, 2023.
CrossRef - IBM Corp. IBM SPSS Statistics for Windows, Version 28.0. Armonk, NY: IBM Corp; 2021.
- Hafiz M.S., Campbell M.D., O’Mahoney L.L., Holmes M., Orfila C., Boesch C. Pulse consumption improves indices of glycaemic control in adults with and without type 2 diabetes: a systematic review and meta-analysis of acute and long-term randomised controlled trials. Eur J Nutr. 2022; 61(2):809-824. DOI: 10.1007/s00394-021-02685-y.
CrossRef - Agrawal S., Ebrahim S. Association between legume intake and self-reported diabetes among adult men and women in India. BMC Public Health. 2013; 13(1):1–13. DOI: 10.1186/1471-2458-13-706.
CrossRef - Villegas R., Gao Y-T., Yang G., Li H-L., Elasy T.A., Zheng W., Shu X.O. Legume and soy food intake and the incidence of type 2 diabetes in the Shanghai Women’s Health Study. Am J Clin Nutr. 2008; 87(1):162. DOI:10.1093/ajcn/87.1.162.
CrossRef - Ramdath D.D., Wolever T.M.S., Siow Y.C., Ryland D., Hawke A., Taylor C., Zahradka P., Aliani M. Effect of processing on postprandial glycaemic response and consumer acceptability of lentil-containing food items. 2018; 7(5):76. DOI: 10.3390/foods7050076.
CrossRef - Ramdath D.D., Liu Q., Donner E., Hawke A., Kalinga D., Winberg J., Wolever T.M.S. Investigating the relationship between lentil carbohydrate fractions and in vivo postprandial blood glucose response by use of the natural variation in starch fractions among 20 lentil varieties. Food Funct. 2017; 8:3783–3791. DOI: 10.1039/c7fo00972k.
CrossRef - Moreno-Valdespino C.A., Luna-Vital D., Camacho-Ruiz R.M., Mojica L. Bioactive proteins and phytochemicals from legumes: Mechanisms of action preventing obesity and type-2 diabetes. Food Res. Int. 2020; 130:108905. DOI:10.1016/j.foodres.2019.108905.
CrossRef - Lin D., Xiao M., Zhao J., Li Z., Xing B., Li X., Kong M., Li L., Zhang Q., Liu Y., Chen H., Qin W., Wu H., Chen S. An overview of plant phenolic compounds and their importance in human nutrition and management of type 2 diabetes. 2016; 21(10): 1374. DOI: 10.3390/molecules21101374.
CrossRef - McCrory M.A., Hamaker B.R., Lovejoy J.C., Eichelsdoerfer P.E. Pulse consumption, satiety, and weight management. Adv Nutr. 2010; 1(1): 17-30.DOI: 10.3945/an.110.1006.
CrossRef - Clarke S.T., Sarfaraz S., Qi X., Ramdath D.G., Fougere G.C., Ramdath D.D. A Review of the relationship between lentil serving and acute postprandial blood glucose response: effects of dietary fibre, protein and carbohydrates. 2022;14(4):849. DOI: 10.3390/nu14040849.
CrossRef - Anderson G., Liu Y., Smith C., Liu T., Nunez M., Mollard R., Luhovyy B.L. The acute effect of commercially available pulse powders on postprandial glycaemic response in healthy young men. Br J Nutr. 2014; 112(12): 1966-1973. DOI: 10.1017/S0007114514003031.
CrossRef

This work is licensed under a Creative Commons Attribution 4.0 International License.


