
Introduction
Kacang goat (Capra hircus) is a local Indonesian goat breed with significant potential for development as a source of nutritional food. It is adaptable to limited environmental conditions and is both prolific and resistant to parasitic infections. It represents 41.9% of the total goat population in Indonesia.1 However, investigations on the nutritional profile of meat produced from Kacang goat are limited, especially regarding its fatty acid (FA) composition. Mirdhayati et al.2 observed that male Kacang goats at 1.5 years of age were fed a forage (unselected) and concentrate-based diet exhibited favorable meat attributes. These included optimal fat content, desirable fatty acid composition, and an advantageous ratio of n-6 to n-3 FA.
The quality and nutritional value of meat are significantly influenced by the type of feed consumed by the animal. Forage species from leguminous plants serve as a protein source and significantly increase the intake of polyunsaturated fatty acids (PUFA).3 Girard et al.4 observed that incorporating legume silage into diets for sheep leads to higher levels of C20:4 n-6, C20:3 n-6, C20:5 n-3, and C22:5 n-3 fatty acids in intramuscular fat. Similarly, Hampel et al.5 highlighted that including legumes in lamb diets improves the fatty acid profile and antioxidant content of the meat. Indigofera zollingeriana, characterized by its high nutritional value and digestibility, is a valuable component of ruminant feed.6, 7 I. zollingeriana is a tree legume that is native in tropical regions and is widely distributed in Indonesia. The species is found at all altitudes across the islands of Sumatra, Java, and Borneo.7. Currently, I. zollingeriana is recognized as a source of forage for ruminants due to its availability throughout the year. In vitro rumen evaluation has shown that increasing the proportion of I. zollingeriana to Brachiaria decumbens grass in rations can improve the C18 content of unsaturated fatty acids and reduce the accumulation of C18:0 in goat rumen fluid.8 This occurrence might be attributed to the presence of polyphenols present in tropical flora, hypothesized to impede the biohydrogenation of unsaturated fatty acids in the rumen. Consequently, this inhibition leads to enhanced accumulation of PUFA within the ruminal system.9 However, there are indications that rumen microbes, namely Streptococcus gallolyticus, can degrade polyphenol components, specifically tannins.10 Phenols and tannins are reported to be 2.46 and 1.13 g/100 g dry matter in the aerial parts (leaf and stem) of I. zollingeriana.3 The effects of I. zollingeriana on fatty acid composition, cholesterol, and fat content in different Kacang goat muscles remain unstudied. Studies conducted by Abuelfatah et al.11 observed variations in C18:3 n-3, conjugated linoleic acid, n-6/n-3 ratio, and overall fatty acid composition across the Longissimus dorsi, Supraspinatus, and Semitendinosus muscles in crossbred Boer goats. This indicates that differences in the location or type of goat muscle contribute to differences in FA profiles.
Based on the available data, research on the effects of including I. zollingeriana in ruminant diets has primarily focused on its nutritional content and digestibility. However, there is lack of studies conducted on the fatty acid composition and fat profile of Kacang goat muscle. Therefore, this study aimed to investigate the effect of a diet containing I. zollingeriana on improving PUFA composition, fat attributes, and its potential as a functional food in Kacang goat muscle.
Materials and Methods
Animal Experimentation
This study was conducted in semi-intensive cages in Padang City, West Sumatra Province, Indonesia for three months. Individual wooden cages were used, with a minimum–maximum temperature range of 22–36°C, and air humidity of 84–89%. A population of 16 young male Kacang goats, approximately 1.5 years old, and weighing an average of 11.6 ± 1.5 kg, were selected for the study. These goats were housed individually in wooden cages measuring 100 × 125 cm each. Subcutaneous injection of ivermectin (0.5 mL/head) was administered to treat animals with ectoparasite and endoparasite infections during the rearing period. The animals were fed rations twice daily, once in the morning and once in the evening, with continuous access to drinking water throughout the day.
Experimental Rations
The quantity of dry matter-based rations was 4% of body weight.12 In the control treatment (CON) used concentrate-based or grain-based ration consisting of a mixture of rice bran, corn fines and tofu dregs. To meet the fiber requirements, local forage (Passiflora foetida) was provided ad libitum. Goats were given concentrated feed of up to 1% of their body weight. A 2-week acclimation period was conducted to allow the goats to adjust to the cages and treatment rations before a 12-week (84-day) feeding trial. The following ration formations were tried:
CON = 50% rice bran + 30% corn fines + 20% tofu dregs
IZ60 = 60% I. zollingeriana + 30% B. decumbens + 10% rice bran
IZ75 = 75% I. zollingeriana + 15% B. decumbens + 10% rice bran
IZ90 = 90% I. zollingeriana + 0% B. decumbens + 10% rice bran
Animal Slaughter and Samples
Following the rearing phase, animals underwent 12-hours fasting period before being weighed to determine the average final body weight (15.01 ± 2.05 kg). The animals were slaughtered via exsanguination, involving severing jugular vein, carotid artery, and trachea. The slaughtering process is carried out in privately owned ruminant abattoirs in Padang City, Indonesia. Muscle samples from Supraspinatus, Longissimus dorsi, and Biceps femoris were collected, weighed, and wrapped in plastic film, then stored in a styrofoam container with dry ice for transport. Upon arrival at the laboratory, the collected muscle samples were then repackaged into polyethylene plastic containers, frozen in the freezer at -5°C for 24 hours, and further analyzed.
Chemical Analysis
Proximate analysis of the treatment rations according to the guidelines established by the Association of Official Analytical Chemists (AOAC) to determine the crude protein, crude fat, and ash.13 Neutral detergent fiber was analyzed using the Van Soest procedure.14 The non-cellulosic carbohydrates were assessed using the formula outlined by Bai et al.15, while the total digestible nutrient (TDN) of the mixed grass and tropical legume-based ration were determined using the equation of Indah et al.16 Total phenolics and tannins were quantified based on the method described by Makkar17, while saponin content was analyzed according to the method of Hiai et al.18
The sample preparation technique employed the direct extraction approach with a Soxhlet. Up to 1-2 grams of the sample were weighed and placed into extraction thimbles, wrapped with cotton, and dried in an oven at 55ºC for an hour. The hulls were placed in a Soxhlet device, which was coupled to a 300 mL fat flask containing dried and weighed boiling stones. Hexane was added through the Soxhlet apparatus until the fat flask was half full and the hulls were completely covered. The apparatus was set up with a condenser and a heating mantle, and the sample was extracted for three hours. The hexane was then distilled, and the fat residue was oven-dried at 105°C. The fat flask containing the residual fat was cooled within a desiccator until it reached ambient temperature, The flask was then weighed, and the drying process at 105°C was repeated until attaining a consistent mass. To calculate the fat content, divide the difference between the final weight of the fat flask and sample weight by the total weight of the sample and express the result as a percentage.
The quantification of cholesterol in the muscle specimens was conducted according to the methodology outlined in the ASEAN Manual of Food Analysis.19 The assay method used gas chromatography (Agilent Technologies, USA) with HP-5MS UI column. Ten milligrams of the internal standard 5α-cholestane were accurately weighed and transferred to a volumetric flask, followed by dissolution in n-heptane to achieve a homogenous solution. Up to 1 gram of the sample was weighed for the saponification, extraction, and derivatization process. A 1 microliter aliquot was injected into the gas chromatograph, which was operated at a temperature of 305°C. Nitrogen was used as the carrier gas at a flow rate of 2 mL/min. Detection was facilitated by a flame ionization detector (Perkin Elmer Inc., USA). The obtained data were then compared with the internal standard. The analysis involved assessing the fatty acid composition, cholesterol, and muscle fat content.
Fatty Acid Content Analysis
The saturated and unsaturated fatty acid analysis followed the AOAC method.20 The standard solution of fatty acid methyl ester (FAME), with carbon chain lengths ranging from C4 to C24, was dissolved in hexane and subsequently then transferred into a 10 mL volumetric flask. The FAME standard solution was then transferred to a vial and labeled accordingly. In the initial phase of sample preparation employing the BF3-methanol technique, samples were placed into a 50 mL Falcon tube along with 6 mL of hexane. The amalgam underwent agitation via a mechanical shaker operating at 450 rpm for 5 minutes. Following this, approximately 3 mL of deionized water was added, followed by vortexed for 1 minute, and then centrifugation at 4500 rpm for 3 minutes. The supernatant was collected and transferred to a 10 mL screw-cap tube, and the hexane solvent was evaporated under a stream of nitrogen at a temperature of 50°C. For methylation, 1.5 mL of 0.5 M potassium hydroxide in methanol to the tube containing the extracted sample. The mixture underwent heating at 100°C using a water bath for 20 minutes, followed by cooling to room temperature, and then 1.5 mL of 20% BF3 solution was added. Subsequently, the solution was reheated to 100°C in a water bath for another 20 minutes and then cooled to 30°C. A mixture of 3 mL of saturated sodium chloride solution and 2.0 mL of hexane was added, and the solution was stirred for 2 minutes. After layers separated, the organic, layer was carefully transferred to a 2 mL tube containing anhydrous sodium sulfate and allowed to stand for 15 minutes. The solution was transferred to a 2 mL vial and approximately 1.0 μL was injected into a gas chromatography-flame ionization detector (GC-FID) system (Agilent 7890B, Agilent Technologies, USA) with an inlet temperature of 225ºC. The system was equipped with a capillary column (Supelco SPTM-2560) measuring 100 m × 0.25 mm × 0.2 μm. The peaks observed in the chromatogram during sample analysis were identified as C4–C24 chain fatty acids. Quantitative analysis was conducted by comparing the retention times of individual fatty acid components in the sample with those of standard references.
Data Analysis
This study utilized a completely randomized design, incorporating four experimental ration treatments with four replications each. Collected data were analyzed using a one-way ANOVA to determine the effect of treatments on muscle FA composition. Furthermore, a two-way ANOVA was used to analyze the effects of treatment and muscle group on PUFA composition. The data analysis was conducted using JASP software version 0.13.1.21 Data that showed a significant level of P<0.05 or higher (P<0.01 and P<0.001) were further analyzed with the Tukey test. principal component analysis (PCA) was employed in Minitab software version 20.3 to examine the relationship between dietary treatments affecting fatty acid profiles across different locations within Kacang goat muscle.
Results
Nutrient and Fatty Acid Profile of Rations
Table 1 illustrates the nutrient and FA compositions of the rations. The forage-based ration containing I. zollingeriana exhibited a higher crude protein content ranging from 24.90% to 29.11% compared to the control ration at 16.84%. Among the treatment rations, IZ90 demonstrated the lowest crude fiber content at 11.64%. The predominant FA types in the rations were C18:2 n-6 (36.87%), C18:1 n-9 (36.22%), and C18:0 (2.58%). In both the I. zollingeriana and B. decumbens forage rations, C18:2 n-6 and C18:1 n-9 were the dominant FA, varying from 33.63% to 34.22% and 33.33% to 36.21%, respectively.
Table 1: Nutrition profile and FA composition of treatment
|
Items |
Treatment | |||
|
CON |
IZ60 | IZ75 |
IZ90 |
|
|
Nutrition profile (% DM) |
||||
|
Dry matter |
80.74 | 87.86 | 87.54 | 87.22 |
| Crude protein | 16.84 | 24.90 | 27.51 |
29.11 |
|
Ether extract |
11.84 | 3.51 | 3.82 | 3.94 |
| Crude fiber | 13.96 | 16.07 | 13.85 |
11.64 |
|
Ash |
5.14 | 9.54 | 9.54 | 9.55 |
| NFE | 52.22 | 45.98 | 45.28 |
45.76 |
|
TDN |
81.27 | 67.76 | 70.17 | 72.16 |
|
Plant secondary metabolite (% DM) |
||||
|
Total phenolic |
– | 1.83 | 2.02 | 2.21 |
| Tannin | – | 0.96 | 0.99 |
1.02 |
|
Saponin |
– | 1.50 | 1.88 | 2.25 |
|
Fatty acid composition (% identified FA) |
||||
|
C18:0 |
2.58 | 4.65 | 4.46 | 5.02 |
| C18:1 n-9 | 36.22 | 36.21 | 33.33 |
34.31 |
|
C18:2 n-6 |
36.87 | 34.22 | 33.63 | 33.69 |
| C18:3 n-3 | 2.32 | 24.92 | 28.57 |
26.88 |
NFE: nitrogen-free extract; TDN: total digestible nutrient
Muscle Fatty Acid and Cholesterol Profile
The fatty acid and cholesterol compositions of SS, LD, and BF muscles are shown in Table 2, Table 3, and Table 4, respectively. Within the SS muscles, C18:1 n-9 exhibited the highest prevalence, ranging from 15.66% to 30.17%, followed by C16:0 at 13.95% to 25.63%, and C18:2 n-6 at 17.31% to 21.66%. Notably, there was a reduction (P<0.001) in the proportion of C18:0 in IZ60 (7.63%) and IZ75 (9.30%) in comparison to the control group (10.82%). Furthermore, IZ90 had the highest PUFA content of 37.11% and the lowest saturated fatty acid (SFA) of 33.55% in SS muscle while the cholesterol content decreased significantly (P<0.001) in IZ60, IZ75, and IZ90 compared to the control. I. zollingeriana-based rations affected the fatty acid composition of LD muscle with C16:0 and SFA accumulation values of 18.04–24.81% and 37.96–57.83%, respectively. IZ90 had the lowest LD muscle cholesterol content of 46.71 mg/100 g compared to the other treatments.
Table 2: Fatty acid composition (% identified FA), fat content (%), cholesterol (g/100 g) Supraspinatus (SS) muscle of Kacang goat in different treatments
|
Items |
Treatment | P-value |
SEM |
|||
|
CON |
IZ60 | IZ75 |
IZ90 |
|||
|
C14:0 |
1.66c | 4.78a | 2.32b | 2.26b | *** | 0.69 |
| C16:0 | 14.18c | 24.02b | 25.63a | 13.95d | *** |
3.12 |
|
C17:1 |
5.69a | 5.49a | 5.29a | 4.81b | ** | 0.18 |
| C18:0 | 10.82a | 7.63c | 9.30b | 11.26a | *** |
0.22 |
|
C18:1 n-9 |
15.66d | 30.17a | 26.49b | 18.70c | *** | 0.38 |
| C18:2 n-6 | 18.09b | 18.78b | 17.31c | 21.66a | *** |
0.94 |
|
C18:3 n-3 |
2.96b | 2.38c | 1.31d | 3.52a | *** | 0.06 |
| C20:4 n-6 | 11.23a | 6.81c | 5.75d | 10.42b | ** |
1.33 |
|
C22:0 |
5.51a | 5.92a | 5.00a | 4.40b | * | 0.32 |
| PUFA n-3A | 4.39a | 2.38b | 1.60c | 4.46a | *** |
0.05 |
|
PUFA n-6B |
30.07a | 18.37c | 23.03b | 32.56a | *** | 0.87 |
| PUFAC | 34.46a | 18.31c | 24.35b | 37.11a | *** |
0.82 |
|
MUFAD |
28.71c | 30.17b | 35.33a | 29.34c | *** | 0.36 |
| UFAE | 63.20b | 48.47d | 59.65c | 66.44a | *** |
0.58 |
|
SFAF |
36.80c | 51.52a | 40.31b | 33.55d | *** | 0.57 |
| PUFA n-6/n-3 | 6.82 | 7.64 | 10.06 | 6.51 | ns |
3.11 |
|
PUFA/SFA |
0.93b | 0.35d | 0.60c | 1.10a | *** | 0.02 |
| UFA/SFA | 1.71a | 0.94b | 1.47a | 1.98a | *** |
0.22 |
|
TIG |
0.69b | 1.11a | 1.18a | 0.68b | *** | 0.01 |
| Fat | 0.17 | 0.16 | 0.17 | 0.17 | ns |
0.04 |
|
Cholesterol |
74.43a | 63.16b | 48.24d | 55.38c | *** |
0.17 |
a,b,c,d Diverse superscript symbols within identical rows indicated notable statistical significance (P < 0.05), where “ns” denotes insignificance, “*” signifies significance at P < 0.05, “**” at P < 0.01, and “***” at P < 0.001. The abbreviations used include CON for a mixture comprising 50% rice bran, 30% corn, and 20% tofu dregs; IZ60 representing a blend of 60% I. zollingeriana, 30% B. decumbens, and 10% rice bran; IZ75 indicating a combination of 75% I. zollingeriana, 15% B. decumbens, and 10% rice bran; and IZ90 denoting a composition of 90% I. zollingeriana, 0% B. decumbens, and 10% rice bran. The term SEM stands for the standard error of the mean. Additionally, variables are defined as follows: A for total polyunsaturated fatty acids n-3, B for total polyunsaturated fatty acids n-6, C for total polyunsaturated fatty acids, D for total monounsaturated fatty acids n-9, E for total unsaturated fatty acids, and F for total saturated fatty acids. The thrombogenicity index, represented by G, is calculated as (C14:0 + C16:0 + C18:0)/[(0.5 × MUFA) + (0.5 × PUFA n-6) + (3 × PUFA n-3) + (PUFA n-3/n-6)].
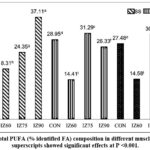 |
Figure 1: Total PUFA (% identified FA) composition in different muscles. Different superscripts showed significant effects at P <0.001. |
In the BF muscle, C16:0 was the dominant fatty acid in IZ60 and IZ75 with values of 11.59% and 23.39%, respectively. In contrast, C18:1 constituted the largest proportion in both the control (24.63%) and IZ90 (24.34%). A notable increase in the PUFA composition of BF muscle was observed, correlating with the increasing proportion of I. zollingeriana in the diet (P<0.001). Conversely, cholesterol content decreased (P<0.001). Figure 1 presents a comparison of total PUFA across different muscle locations. The increased presence of I. zollingeriana in diets IZ75 and IZ90 resulted in a substantial increase (P<0.001) in the percentage of PUFA in muscle samples compared to those from animals receiving the control diet.
Table 3: Fatty acid composition (% identified FA), fat content (%), cholesterol (g/100 g) Longissimus dorsi (LD) muscle of Kacang goat in different treatments
|
Items |
Treatment | P-value | SEM | |||
| CON | IZ60 | IZ75 |
IZ90 |
|||
|
C14:0 |
1.82a | 2.55a | 1.10b | 2.22a | ** | 0.31 |
| C16:0 | 18.04c | 24.81a | 19.74b | 24.31a | *** |
0.38 |
|
C17:1 |
4.69b | 2.28d | 6.51a | 3.30c | *** | 0.91 |
| C18:0 | 12.10b | 25.32a | 11.77c | 8.82d | *** |
0.02 |
|
C18:1 n-9 |
18.50c | 23.00a | 18.81c | 19.50b | *** | 0.09 |
| C18:2 n-6 | 15.45b | 9.79d | 18.63a | 14.14c | *** |
0.16 |
|
C18:3 n-3 |
2.36a | 1.75b | 2.12a | 1.99a | ** | 0.12 |
| C20:4 n-6 | 9.01b | 2.24c | 9.78b | 10.20a | *** |
1.87 |
|
C22:0 |
3.81c | 1.21d | 4.34b | 5.89a | *** | 0.05 |
| PUFA n-3A | 2.36a | 1.85b | 2.11a | 2.00a | *** |
0.10 |
|
PUFA n-6B |
25.22b | 12.24c | 28.42a | 24.34b | *** | 0.27 |
| PUFAC | 28.95b | 14.40d | 31.29a | 26.33c | *** |
0.26 |
|
MUFAD |
29.20b | 27.74c | 30.75a | 27.19c | *** | 0.08 |
| UFAE | 58.14b | 47.49d | 62.03a | 53.52c | * |
3.12 |
|
SFAF |
41.85c | 57.83a | 37.96d | 46.47b | *** | 0.32 |
| PUFA n-6/n-3 | 10.67 | 10.63 | 13.50 | 12.14 | ns |
2.83 |
|
PUFA/SFA |
0.69b | 0.25c | 0.82a | 0.57b | *** | 0.24 |
| UFA/SFA | 1.38a | 0.82b | 1.64a | 1.15a | *** |
0.38 |
|
TIG |
0.98b | 1.82a | 0.94b | 1.15b | ** | 0.17 |
| Fat | 0.28b | 0.29b | 0.33a | 0.34a | ** |
0.01 |
|
Cholesterol |
54.41c | 73.12a | 62.35b | 46.71d | *** |
0.90 |
a,b,c,d Diverse superscript symbols within identical rows indicated notable statistical significance (P < 0.05), where “ns” denotes insignificance, “*” signifies significance at P < 0.05, “**” at P < 0.01, and “***” at P < 0.001. The abbreviations used include CON for a mixture comprising 50% rice bran, 30% corn, and 20% tofu dregs; IZ60 representing a blend of 60% I. zollingeriana, 30% B. decumbens, and 10% rice bran; IZ75 indicating a combination of 75% I. zollingeriana, 15% B. decumbens, and 10% rice bran; and IZ90 denoting a composition of 90% I. zollingeriana, 0% B. decumbens, and 10% rice bran. The term SEM stands for the standard error of the mean. Additionally, variables are defined as follows: A for total polyunsaturated fatty acids n-3, B for total polyunsaturated fatty acids n-6, C for total polyunsaturated fatty acids, D for total monounsaturated fatty acids n-9, E for total unsaturated fatty acids, and F for total saturated fatty acids. The thrombogenicity index, represented by G, is calculated as (C14:0 + C16:0 + C18:0)/[(0.5 × MUFA) + (0.5 × PUFA n-6) + (3 × PUFA n-3) + (PUFA n-3/n-6)].
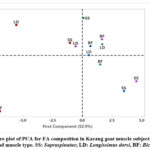 |
Figure 2: Score plot of PCA for FA composition in Kacang goat muscle subjected to feeding treatment and muscle type. SS: Supraspinatus; LD: Longissimus dorsi, BF: Biceps femoris. |
The score plot depicted in Figure 2 illustrates the correlation distribution between dietary treatments and fatty acid compositions across various muscle types of Kacang goats, with an overall variance of 69%. This suggests a resemblance in fatty acid profiles within the LD and BF muscles across the CON, IZ75, and IZ90 treatments. In contrast, the biplot presented in Figure 3 demonstrates a positive association among MUFA (C17:1), PUFA (C18:2 n-6, C18:3 n-3, C20:4 n-6, PUFA n-6, and PUFA n-3), unsaturated fatty acids (UFA), UFA/SFA ratio, and C22:0. Conversely, there is a negative correlation with SFA components (C14:0, C16:0, and C18:0), PUFA n-6/n-3 ratio, total fat content, thrombogenicity index (TI), and cholesterol levels.
Table 4: Fatty acid composition (% identified FA), fat content (%), cholesterol (g/100 g) Biceps femoris (BF) muscle of Kacang goat in different treatments
|
Items |
Treatment | P-value | SEM | |||
| CON | IZ60 | IZ75 |
IZ90 |
|||
|
C14:0 |
1.44c | 5.34a | 1.56c | 4.14b | *** | 0.96 |
| C16:0 | 18.63b | 11.59d | 23.39a | 17.31c | *** |
0.23 |
|
C17:1 |
4.17b | 1.65d | 3.63c | 5.22a | *** | 0.11 |
| C18:0 | 9.27b | 7.58c | 9.76b | 11.61a | *** |
0.17 |
|
C18:1 n-9 |
24.63a | 10.63c | 19.40b | 24.34a | *** | 0.12 |
| C18:2 n-6 | 15.73b | 7.40c | 17.97a | 17.42a | *** |
0.16 |
|
C18:3 n-3 |
1.97c | 1.10d | 3.07a | 2.39b | *** | 0.04 |
| C20:4 n-6 | 8.19b | 6.07c | 9.78a | 7.75b | *** |
0.17 |
|
C22:0 |
4.22b | 2.99d | 5.02a | 3.51c | *** | 0.07 |
| PUFA n-3A | 1.97c | 1.10d | 3.07a | 2.39b | *** |
0.04 |
|
PUFA n-6B |
24.65c | 13.45d | 27.76a | 25.89b | *** | 0.22 |
| PUFAC | 27.48c | 14.58d | 30.84a | 29.43b | *** |
0.23 |
|
MUFAD |
34.12b | 16.06d | 27.98c | 35.49a | *** | 0.17 |
| UFAE | 61.60b | 30.63d | 58.80c | 64.92a | *** |
0.39 |
|
SFAF |
38.39c | 69.37a | 41.19b | 35.08d | *** | 0.39 |
| PUFA n-6/n-3 | 12.54a | 12.27a | 8.96c | 10.69b | *** |
0.11 |
|
PUFA/SFA |
0.71c | 0.21d | 0.74b | 0.83a | *** | 0.14 |
| UFA/SFA | 1.60b | 0.44d | 1.43c | 1.85a | *** |
0.03 |
|
TIG |
0.86b | 1.38a | 0.98b | 0.92b | ** | 0.06 |
| Fat | 0.20 | 0.20 | 0.20 | 0.22 | ns |
0.01 |
|
Cholesterol |
72.83a | 97.90d | 65.63c | 47.54b | *** |
0.94 |
a,b,c,d Diverse superscript symbols within identical rows indicated notable statistical significance (P < 0.05), where “ns” denotes insignificance, “*” signifies significance at P < 0.05, “**” at P < 0.01, and “***” at P < 0.001. The abbreviations used include CON for a mixture comprising 50% rice bran, 30% corn, and 20% tofu dregs; IZ60 representing a blend of 60% I. zollingeriana, 30% B. decumbens, and 10% rice bran; IZ75 indicating a combination of 75% I. zollingeriana, 15% B. decumbens, and 10% rice bran; and IZ90 denoting a composition of 90% I. zollingeriana, 0% B. decumbens, and 10% rice bran. The term SEM stands for the standard error of the mean. Additionally, variables are defined as follows: A for total polyunsaturated fatty acids n-3, B for total polyunsaturated fatty acids n-6, C for total polyunsaturated fatty acids, D for total monounsaturated fatty acids n-9, E for total unsaturated fatty acids, and F for total saturated fatty acids. The thrombogenicity index, represented by G, is calculated as (C14:0 + C16:0 + C18:0)/[(0.5 × MUFA) + (0.5 × PUFA n-6) + (3 × PUFA n-3) + (PUFA n-3/n-6)].
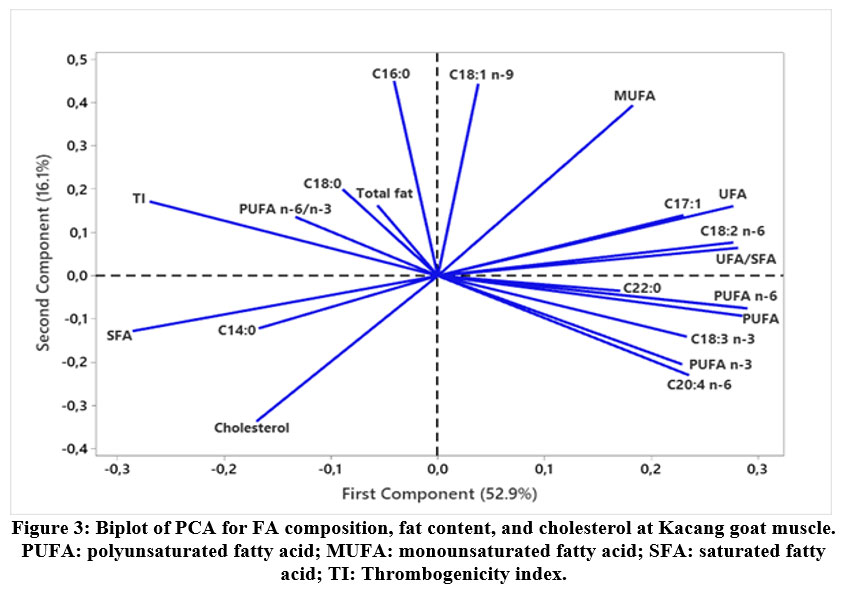 |
Figure 3: Biplot of PCA for FA composition, fat content, and cholesterol at Kacang goat muscle. PUFA: polyunsaturated fatty acid; MUFA: monounsaturated fatty acid; SFA: saturated fatty acid; TI: Thrombogenicity index. |
Discussion
The percentages of total PUFA in various Kacang goat muscles varied according to the treatment. The greatest increases in PUFA compared to the control ration from the SS, LD, and BF muscles were 7.7%, 8.0%, and 11%, respectively. The concentrate-based feed as a control ration yielded a percentage of PUFA nearly as high as 90% of the I. zollingeriana diet treatment, and even higher in LD muscle. Concentrate-based rations are rich in fermentable carbohydrates that lower rumen pH and directly affect the microbial populations involved in lipolysis and biohydrogenation processes. This is supported by Castillo-González et al.22 who stated that a high-concentrate diet can inhibit the activity of Anaerovibrio lipolytica and Butyrivibrio fibrisolvens bacteria. Variations in intramuscular fatty acid composition among muscles may be due to differences in the anatomy and function of each skeletal muscle. Costa et al.23 found that muscle types (Semitendinosus, Longissimus dorsi, and Supraspinatus) in Mertolenga bulls significantly affect the intramuscular fatty acid composition and neutral lipid fraction. The reported PUFA composition of concentrate-based diets was lower than that deposited in IZ75 and IZ90-treated Longissimus muscle. An in vivo study by Aghwan et al.24 on Kacang goat fed concentrate-based ration with trace mineral supplementation of 0.6 mg/kg DM Selenium and 0.6 mg/kg DM Iodine showed that the composition of Longissimus muscle PUFA only ranged from 12.29 to 17.45%. The utilization of fresh forage as a source of essential fatty acids for ruminants represents a promising strategy. Although the fatty acid content of fresh forage is relatively low (20–50 kg DM), it is a cheap and safe source for ruminants.25 Abuelfatah et al.11 also reported the LD fatty acid profile of crossed Boer goats fed a diet containing 10–20% whole linseed. The highest fatty acid percentages were, in descending order, C18:1 n-9 (36.18–39.45%), C16:0 (18.11–18.80%), and C18:0 (15.35–16.85%).
At 75–90% I. zollingeriana composition, changes in LD fatty acid profile with the highest percentages were noted in C16:0, C18:1 n-9, and C18:2 n-6. The increased PUFA composition in ruminant meat may attributed to the intake of secondary metabolites such as phenols and tannins.3 These metabolites can reduce biohydrogenation, leading to greater PUFA absorption in animals.8,9 The observed increase in PUFA content in the IZ groups suggests a beneficial effect of I. zollingeriana on the fatty acid profile of goat meat. However, variations in other dietary nutrients may also have contributed to these results. In comparison, the fatty acid profile of Longissimus lumborum in the Korean native black goat with an intensive alfalfa diet treatment for 6-month maintenance showed a C18:3 n-3, as well as PUFA and PUFA/SFA ratios of 1.71, 8.86, and 0.21, respectively.26 The PUFA/SFA ratio of LD muscle in Messinese goats with a pasture-based production system was found to be 0.11–0.14.27 Significant changes in C18:3 n-3 and PUFA composition have been found in Hanwoo, American, and Australian beef cattle due to differences in the ration base.28 Furthermore, British × Zebu cattle fed a mixed legume–grass pasture-based diet during the finisher period were found to have a higher proportion PUFA of meat compared to those on a corn-based feed.29 The fatty acid composition of Bali beef fattened using a greenlot farming system had SFA and PUFA values of 36.68% and 26.74%, respectively.30 Generally, the PUFA/SFA ratio in various goat muscles ranges from 0.16 to 0.49.31 The use of grain-fed diets has been shown to significantly increase the C18:1 composition in the Semimembranosus muscle.32 Costa et al.33 observed a comparable outcome, noting a predominance of oleic acid (51.45%) within the L. lumborum muscle of sheep, fed a diet with a high concentrate-to-forage ratio of 80:20. A study by Tarigan34 using I. zollingeriana pellets as a concentrated base for Boerka goat showed LD muscle fatty acid group profiles comprising SFA of 45–51%, a PUFA/SFA ratio of 0.10–0.12, and PUFA n-6/n-3 ratio of 1.05–1.84.
Several factors influence the fatty acid composition of goat meat, including dietary intake, muscle location, breed, sex, age, and slaughter weight. However, diet is the primary factor affecting both fat accumulation and the essential fatty acid profile.35 Forage-based diets can increase the omega-3 fatty acid content of goat meat by more than 50%, thus improving the n-6/n-3 PUFA ratio to meet health standards.36 In contrast, Daley et al.37 suggested that consumers could obtain an equivalent intake of n-3 PUFA and conjugated fatty acids from both grain-fed and grass-fed meat, while grain-fed meat had an advantage in terms of sensory attributes. Differences in muscle location also affected the fatty acid profiles. Consisted with these results, the average fatty acid percentage between the BF and Longissimus thoracic muscles in five cattle breeds including Angus, Friesian Holstein, Australian commercial cross, and Murray Grey showed that the BF muscle tended to deposit higher C18:3 fatty acids, and UFA than the L. thoracic.38
In this study, the proportion of n-6/n-3 PUFA observed in different muscle types of goats did not align with the health recommendation standards set forth by the Department of Health and Social Security39, which specify a maximum value of 4. The PUFA/SFA ratio exceeded the minimum recommended value of 0.45, while the TI varied among muscle types. No significant difference was observed between the control treatment and the ration with a high I. zollingeriana composition. However, the TI value of 0.68 in SP muscle with a ration containing 90% I. zollingeriana composition had a lower value than tilapia (Oreochromis niloticus) meat, which stood at 0.82–0.87. Chen and Liu40 reported a range of TI values for various products sourced from food crops (0.13–0.56), aquaculture (0.14–0.87), and meat (0.28–1.69). Consumption of food products with lower TI values is associated with a reduced risk of developing blood vessel clots, thus positively affecting human cardiovascular health.41
The identified muscle cholesterol content is lower than that obtained by previous studies. This discrepancy may be due to the inclusion of bioactive plant constituents from plants in the diet, which could have reduced cholesterol levels present in the meat. A different result was observed in a diet enriched with vegetable oil as a source of PUFA with no added polyphenol, this diet showed an increase in the blood serum cholesterol levels of Zel sheep.42 Prior studies suggest that the presence of tannins and saponins in animal feed is linked to a reduction in serum cholesterol levels, the inhibition of cholesterol absorption in the small intestine, and the enhancement of bile salt excretion.43, 44 Furthermore, these phytochemical components have been shown to contain antioxidants, which have the potential to enhance the sensory characteristics of PUFA-rich meat.45 Tarigan34 documented variations in the cholesterol concentration (mg/100 g meat) within the L. dorsi muscle of Boer × Kacang goats, which were subjected to different proportions of green concentrate pellets (ranging from 45% to 90% I. zollingeriana) in their diet. The recorded levels of cholesterol concentrations ranged between 51.82 and 62.31 mg/100 g of meat. The average cholesterol concentrations of male goat leg meat in the age group < 1.5 and > 1.5 years were between 112 and 255 and 114 and 256 mg/100 g, respectively.2 Park and Washington46 reported cholesterol levels in Alpine and Nubian breeds in LD and BF muscle samples of 57.8 and 69.5 mg/100 g, respectively. However, lower cholesterol of 44.85–47.76 was reported in Boer goat rations with 4–8% palm and canola oil blends47. Mazhangara et al.48 found varying cholesterol content (mg) in chicken (76), beef (73.1), and lamb (78.2) meat. In addition, to achieve premium ruminant products sustainably, a holistic strategy is required that combines diverse feed resources (concentrate, forages, agricultural waste), appropriate production systems (extensive or intensive), and provides balanced feed nutrition to ensure the production of high-quality meat.49,50 The complexity of the interaction between dietary components and animal metabolism necessitates careful interpretation of the results of this study. While this study highlights the potential benefits of I. zollingeriana in goat nutrition, further research with improved feed regimes is essential to elucidate its role in modulating meat fatty acid composition and sensory characteristics.
Conclusion
Increasing the level of I. zollingeriana within the dietary regimen of Kacang goats demonstrates the potential to improve the beneficial fatty acid profile, specifically by increasing the levels of linoleic acid (C18:2 n-6) and linolenic acid (C18:3 n-3), while decreasing the levels of total saturated fatty acids in muscle tissue. Notably, the I. zollingeriana ration resulted in a muscle fatty acid profile with PUFA content comparable to that of a concentrate ration, suggesting its potential as an alternative feed source for enhancing the nutritional quality of goat meat. This study confirms that changes in fatty acid distribution, namely fat and cholesterol content, are affected by both muscle type and the diet fed to Kacang goats. Interestingly, a negative correlation was observed between TI values and the I. zollingeriana inclusion levels, indicating that a higher proportion of I. zollingeriana in the diet led to lower TI values in the meat. This finding underscores the potential of I. zollingeriana in producing healthier meat with a reduced risk of blood clot formation. Based on the criteria of polyunsaturated fatty acid composition, PUFA/SFA ratio, thrombogenicity index, and cholesterol content, it can be concluded that meat produced from a ration based on 75% I. zollingeriana and 15% B. decumbens can be categorized as a healthy food from an animal source.
Acknowledgement
The authors wish to thank the Faculty of Animal Science, Andalas University, the Research Center for Applied Zoology, and the Directorate of Talent Management BRIN for their invaluable support and collaboration in this research.
Funding Sources
This research is supported by the PMDSU research scheme and BRIN postdoctoral grant batch II (code 151/II/HK/2022).
Conflict of Interest
The authors declare having no conflict of interest.
Data Availability Statement
This statement does not apply to this article.
Ethics Statement
The comfort and safety of the ruminant animals in this study follow the National Standardization Agency of Indonesia guidelines (SNI 99003:2018).
Informed Consent Statement
This study did not involve human participants, and therefore, informed consent was not required.
Permission to Reproduce Material from other Sources
Not applicable
Clinical Trial Registration
This research does not involve any clinical trials.
Author Contributions
- Malik Makmur: Conceptualization, Methodology, Writing – Original Draft.
- Mardiati Zain: Data Collection, Supervision, Project Administration.
- Yetti Marlida: Supervision, Project Administration.
- Khasrad: Supervision, Resources
- Anuraga Jayanegara: Supervision, Project Administration.
- Evy Arida: Funding Acquisition, Supervision.
References
- Batubara A., Mahmilia F., Inounu I., Tiesnamurti B., Hasinah H. Kacang goat breeds in Indonesia (in Bahasa). Bogor: IAARD Press; 2012.
- Mirdhayati I., Hermanianto J., Sajuthi D. Carcass profile and chemical characteristic of male Kacang goat (Capra aegragus hircus). Indonesian J. Anim. Vet. 2014;19(1).
CrossRef - Makmur M., Zain M., Marlida Y., Khasrad K., Jayanegara A. Fatty acids composition and biohydrogenation reduction agents of tropical forages. Biodiversitas. 2019;20(7).
CrossRef - Girard M., Dohme‐Meier F., Silacci P., Kragten S. A., Kreuzer M., Bee G. Forage legumes rich in condensed tannins may increase n‐3 fatty acid levels and sensory quality of lamb meat. J. Sci. Food Agric. 2015;96(6):1923-1933.
CrossRef - Hampel V.S., Poli C. H. E. C., Joy M., et al. Tropical grass and legume pastures may alter lamb meat physical and chemical characteristics. Trop. Anim. Health Prod. 2021;53(4).
CrossRef - Tarigan A., Ginting S. P., Ii A., Astuti D. A., Abdullah L. Body Weight Gain, Nutrients Degradability and Fermentation Rumen Characteristics of Boerka Goat Supplemented Green Concentrate Pellets (GCP) Based on Indigofera zollingeriana. Pakistan J. Biol. Sci. 2018;21(2):87-94.
CrossRef - Antari R., Anggraeny Y. N., Putri A. S., Sukmasari P. K., Mariyono N. H. K., Aprilliza M. N., Ginting S. Nutritive and antinutritive contents of Indigofera zollingeriana: Its potency for cattle feed in Indonesia. Livest. Rural Dev. 2022;34:12.
- Makmur M., Zain M., Marlida Y., Khasrad K., Jayanegara A. In vitro ruminal biohydrogenation of C18 fatty acids in mixtures of Indigofera zollingeriana and Brachiaria decumbens. J. Indonesian Trop. Anim. Agric. 2020;45(2):124-135.
CrossRef - Jayanegara A., Kreuzer M., Wina E., Leiber F. Significance of phenolic compounds in tropical forages for the ruminal bypass of polyunsaturated fatty acids and the appearance of biohydrogenation intermediates as examined in vitro. Anim. Prod. Sci. 2011;51(12):1127.
CrossRef - Babaei Y., Rouzbehan Y., Alipour D. Effect of rumen bacteria from sheep adapted to a tanninferous diet on in vitro fermentation parameters of pistachio hulls using bovine inoculum. Iranian J. Vet. Res. 2015. doi:10.22099/ijvr.2015.3288
- Abuelfatah K., Zakaria Md. Z. A. B., Meng G. Y., Sazili A. Q. Changes in fatty acid composition and distribution of N-3 fatty acids in goat tissues fed different levels of whole linseed. Sci. World J. 2014;2014:1-10.
CrossRef - Nutrient requirments of small ruminants: sheep, goats, cervids and new world camelids. Washington D.C.: The National Academies Press; 2007: 384
- Official methods of analysis. 18th Edn. Maryland, USA: Association of Official Analytical Chemists Internasional; 2005.
- Goering H. K., Van Soest P. J. Forage fiber analyses: apparatus, reagents, procedures, and some applications. Washington, USA: United States Department of Agriculture; 1970.
- Bai S., Cao Z. J., Jin X., Wang Y. J., Yang H. J., Li S. L. The effects of step-wise improvement of forage combination in total mixed rations on fatty acid profile in the rumen and milk of Holstein cows. J. Integr. Agric. 2018;17(8):1833-1842.
CrossRef - Indah A. S., Permana I. G., Despal D. Determination total digestible nutrient (TDN) of tropical forage using nutrient composition. Sains Peternakan. 2020;18: 38-43.
CrossRef - Makkar H. P. S. Quantification of tannins in tree and shrub foliage. 2003. DOI:10.1007/978-94-017-0273-7
CrossRef - Hiai S., Oura H., Nakajima T. Color reaction of some sapogenins and saponins with vanillin and sulfur1c acid. Plant. Med. 1976;29(02):116-122. doi:10.1055/s-0028-1097639
CrossRef - ASEAN Manual of Food Analysis. Determination of cholesterol by gas chromatography method. 1st edn. Thailand: Institute of Nutrition, Mahidol University, Regional Centre of ASEAN Network of Food Data System; 2011.
- Official methods of analysis, oil and fat. 17th Edn., Washington, USA: The Association of Official Analytical Chemists. 2000.
- JASP Materials – JASP – Free and User-Friendly Statistical Software. JASP – Free and User-Friendly Statistical Software. 2024. Available from: http://jaspstats.org/jasp-materials/
- Castillo-González A., Burrola-Barraza M., Domínguez-Viveros J., Chávez-Martínez A. Rumen microorganisms and fermentation. Arch. Med. Vet. 2014;46(3):349-361.
CrossRef - Costa P., Roseiro L. C., Bessa R. J. B., et al. Muscle fiber and fatty acid profiles of Mertolenga-PDO meat. Meat Sci. 2007;78(4):502-512.
CrossRef - Aghwan Z. A., Alimon A. R., Goh Y. M., Nakyinsige K., Sazili A. Q. Fatty acids profiles semitendinosus muscles and serum in kacang goats supplemented with inorganic selenium and iodine. Asian-Australasian J. Anim. Sci. 2014;27(4):543-550.
CrossRef - Kalač P., Samková E. The effects of feeding various forages on fatty acid composition of bovine milk fat: A review. Czech J. Anim. Sci. 2010;55(12):521-537.
CrossRef - Hwang Y. H., Bakhsh A., Ismail I., Lee J. G., Joo S. T. Effects of intensive alfalfa feeding on meat quality and fatty acid profile of Korean native black goats. Korean J. Food Sci. An. 2018;38(5):1092-1100.
CrossRef - Liotta L., Chiofalo V., Lo Presti V., Chiofalo B. Effect of production system on growth performances and meat traits of suckling Messinese goat kids. Italian J. Anim. Sci. 2020;19(1):245-252.
CrossRef - Hwang Y. H., Joo S. T. Fatty acid profiles, meat quality, and sensory palatability of grain-fed and grass-fed beef from Hanwoo, American, and Australian crossbred cattle. Korean J. Food Sci. An. 2017;37(2):153-161.
CrossRef - Fruet A. P. B., Stefanello F. S., Trombetta F., et al. fatty acids profile and quality attributes of beef from steers finished on legume and grass pasture. Meat Muscle Biol. 2017;1(3):60-61.
CrossRef - Tahuk P. K., Dethan A. A., Sio S. The composition of saturated and unsaturated fatty acids and cholesterol in meat of bali bull fattened using greenlot system in small holder farming. Indonesian J. Vet. Sci. 2019;12(3).
CrossRef - Banskalieva V., Sahlu T., Goetsch A. L. Fatty acid composition of goat muscles and fat depots: a review. Small Rumin. Res. 2000;37(3):255-268.
CrossRef - Rhee K. S., Waldron D. F., Ziprin Y. A., Rhee K. C. Fatty acid composition of goat diets vs intramuscular fat. Meat Sci. 2000;54(4):313-318.
CrossRef - Costa R. G., Santos N. M. D., De Cássia Ramos Do Egypto Queiroga R., De Sousa W. H., Madruga M. S., Cartaxo F. Q. Physicochemical characteristics and fatty acid profile of meat from lambs with different genotypes and diets. Rev. Bras. Zootec. 2015;44(7):248-254.
CrossRef - Tarigan, A. Indigofera zollingeriana-based green concentrate pellets (GCP) as a feed source for boerka goats [Ph.D. dissertation]. Bogor: Sekolah Pascasarjana Institut Pertanian Bogor. 2018.
- Wattanachant C. Goat meat: some factors affecting fat deposition and fatty acid composition. Songklanakarin J. Sci. Tech. 2018;40(5):1152–1157.
- Meat science and nutrition (in Bahasa). Yogyakarta: Gadjah Mada University Press; 2011.
- Daley C. A., Abbott A., Doyle P. S., Nader G. A., Larson S. A review of fatty acid profiles and antioxidant content in grass-fed and grain-fed beef. Nutr. J. 2010;9(1).
CrossRef - Rusman, Soeparno, Setiyono, Suzuki A. Characteristics of Biceps femoris and Longissimus thoracis muscles of five cattle breeds grown in a feedlot system. Anim. Sci. J. 2003;74(1):59-65.
CrossRef - Department of Health and Social Security. Diet and Cardiovascular Disease. In: Report on Health and Social Subjects. London: Her Majesty’s Stationery Office; 1984.
- Chen J., Liu H. Nutritional indices for assessing fatty acids: A mini-review. Int. J. Mol. Sci. 2020;21(16):5695.
CrossRef - Ulbricht T. L. V., Southgate D. A. T. Coronary heart disease: seven dietary factors. Lancet. 1991;338(8773):985-992.
CrossRef - Akbarinejad V., Niasari-Naslaji A., Mahmoudzadeh H., Mohajer M. Effects of diets enriched in different sources of fatty acids on reproductive performance of Zel sheep. Iranian J. Vet. Res. 2012;13(4):310-316.
- Nakamura Y., Kaihara A., Yoshii K., Tsumura Y., Ishimitsu S., Tonogai Y. Effects of the oral administration of green tea polyphenol and tannic acid on serum and hepatic lipid contents and fecal steroid excretion in rats. J. Health Sci. 2001;47(2):107-117.
CrossRef - Suharti S., Banowati A., Hermana W., Wiryawan K. G. Carcass composition and cholesterol content of broiler chicken suffered from diarrhea and fed bay leaf meal (Syzygium polyanthum Wight). Media Peternakan. 2008;31(2):138-145.
- Alum E. U. Role of phytochemicals in cardiovascular disease management: Insights into mechanisms, efficacy, and clinical application. Phytomed. Plus. 2024;100695.
CrossRef - Park Y. W., Washington A. C. Fatty acid composition of goat organ and muscle meat of alpine and Nubian breeds. J. Food Sci. 1993;58(2):245-248.
CrossRef - Adeyemi K. D., Sabow A. B., Ebrahimi M., Samsudin A. A., Sazili A. Q. Fatty acid composition, cholesterol and antioxidant status of infraspinatus muscle, liver and kidney of goats fed blend of palm oil and canola oil. Italian J. Anim. Sci. 2016;15(2):181-190.
CrossRef - Mazhangara I. R., Chivandi E., Mupangwa J. F., Muchenje V. The potential of goat meat in the red meat industry. Sustainability. 2019;11(13):3671.
CrossRef - Ponnampalam E. N., Priyashantha H., Vidanarachchi J. K., Kiani A., Holman B. W. B. Effects of nutritional factors on fat content, fatty acid composition, and sensorial properties of meat and milk from domesticated ruminants: An overview. Animals. 2024;14:840.
CrossRef - Huang Y., Liu L., Zhao M., Zhang X., Chen J., Zhang Z., et al. Feeding regimens affecting carcass and quality attributes of sheep and goat meat — A comprehensive review. Anim. Biosci. 2023;36(9): 1314–1326.
CrossRef

This work is licensed under a Creative Commons Attribution 4.0 International License.


