
Introduction
Food addiction is defined as uncontrollable eating behavior, manifesting as compulsive overeating, often triggered by exposure to certain types of food 1. These types of food are typically calorie-dense and contain high levels of sugar, fat, and/or salt 1,2. Data from animal, imaging, and epidemiological studies have suggested that foods high in these components, in particular ultra-processed foods, have addictive effects similar to alcohol and drugs 3-5. As food is consumed not just for necessity but for pleasure, it is associated with the brain’s reward mechanisms 6. Food addiction has a strong correlation with various mental health conditions, including eating disorders, mood disturbances, anxiety, and post-traumatic stress disorder, all of which can detrimentally affect an individual’s quality of life 3,7-9.
Stress has been recognized as a significant risk factor in both the onset of addictive disorders and the recurrence of addictive behaviors 10-12. Stress is defined as “the processes of perceiving, appraising, and responding to adverse events or stimuli.” Stressful experiences can arise from emotional and physiological challenges 13. Previous research has shown that such exposure can alter eating patterns, leading individuals to cope with stress through unhealthy but often enjoyable behaviors, including undesirable eating habits 14. However, data on the exact association between perceived stress and eating behavior is inconsistent. Some studies have demonstrated that stress can suppress appetite, while others have shown increased consumption of foods high in energy, sugar, and fat15,16. To date, most research in this area has been conducted in Western countries, with limited research on the Saudi population, whose characteristics and food intake differ considerably from those in Western countries. Therefore, this study aimed to examine the association between perceived stress levels, food addiction, and food intake among adults in Saudi Arabia. Specifically, the study was performed with the following objectives: 1) To assess the levels of perceived stress among adults. 2) To estimate the prevalence of food addiction among adults. 3) To determine the association between perceived stress levels and food addiction. 4) To examine the relationship between perceived stress levels and dietary intake. 5) To examine the association between food addiction and dietary intake.
Determining these associations will contribute to the development of interventions aimed at helping adults manage their stress using various techniques without resorting to food addiction.
Materials and Methods
Study design and population
A cross-sectional study was conducted among adults in Saudi Arabia through an online survey. The survey was distributed in Arabic through social media platforms, including Telegram, WhatsApp, and Twitter. The study involved male and female, aged 18 years and above who live in Saudi Arabia.
Inclusion and exclusion criteria
Native Arabic-speaking individuals living in the Kingdom of Saudi Arabia were included in the study, regardless of nationality. Participants were excluded if they had any medical conditions that might affect their typical eating behavior. Pregnant women were also excluded, as were participants under 18 years of age and those who failed to respond to at least one of the scale items.
Data collection
Data were collected from May 2022 to December 2023. Before collecting the data, an ethics statement was approved by King Abdul-Aziz University’s Biomedical Ethics Research Committee (Reference No. 292-21). An online consent form was presented on the first page of the online survey. The estimated minimum sample size needed for this study was 385 adults, based on a 95% confidence level, a 5% acceptable margin of error, and a response distribution of 50%.
Demographic Measurements
Demographic measurements collected included age, gender (male or female), marital status (single, married, divorced, or widowed), education level (high school, diploma, bachelor, or postgraduate), occupation (employee, unemployed, self-employed, unable to work, housewife, or retired).
Participants were also assessed on the presence of any chronic diseases (diabetes, cardiovascular disease, or blood pressure), smoking status (smoking, nonsmoker, or previous smoker), and regularity of physical activity lasting a minimum of 30 minutes response options regarding physical activity included: (every day, 1–2 times a week, 3–4 times a week, and 5–6 times a week). Responses of ‘3-4 times a week,’ ‘5-6 times a week,’ and ‘daily’ were coded as ‘physically active.’ Responses of ‘never,’ ‘rarely,’ and ‘1-2 times a week’ were coded as ‘not physically active.’ Additionally, participants were inquired about any existing health conditions, such as cardiovascular disease, high blood pressure, or diabetes.
Food addiction assessment
Food addiction was evaluated using the validated Arabic version of the modified Yale Food Addiction Scale 2.0 (mYFAS 2.0). This version has been previously found to be reliable and valid for Arabic-speaking populations 17,18. The mYFAS scale was modified to assess symptoms over the past month, unlike the original version that assesses symptoms over the past year. This scale comprises 13 items inquiring about symptoms related to eating habits, particularly the consumption of high-fat/high-sugar foods in the previous month. Among these items, 11 are used to evaluate addictive eating behaviors, while the remaining two assess clinical significance (i.e., distress or impairments). Each item was measured on an 8-point scale reflecting frequency, ranging from ‘never’ to ‘every day.’ The severity of food addiction was categorized as mild (score = 2–3), moderate (score = 4–5), or severe (score = 6 or more).
Dietary intake measurement
A validated short food frequency questionnaire (FFQ) was administered to participants to assess their dietary intake18. Participants were asked to indicate the frequency (days/week) of consuming various food items using a 9-point Likert scale, ranging from ‘6 times a day’ to ‘never.’ Foods were grouped into the following categories: fast food (e.g., fried foods, pizza, and burgers), sweet snacks (e.g., chocolate, cookies, and cakes), and savory snacks (biscuits, pretzels, and chips), fruit, vegetables, nuts, soft drinks, and energy drinks 18.
Perceived Stress
Stress was assessed using the validated Arabic version of the Perceived Stress Scale (PSS)19, which measures the extent to which individuals perceive conditions in their lives as stressful 19,20. The questionnaire comprises ten items related to feelings and thoughts in the previous month. Each item uses a 5-point scale to indicate frequency, with responses ranging from ‘never’ (0) to ‘very often’ (4); items 4, 5, 7, and 8, are reverse-coded in terms of frequency. Scores range from 0 to 40, with higher scores reflecting greater perceived stress levels. Based on the cumulative scores of all ten questions, perceived stress was grouped into three categories: low stress (0–13), moderate stress (14–26), and high perceived stress (27–40).
Analysis
Data analysis was performed using IBM SPSS statistics version 26.0 for Windows. Continuous data were expressed as mean ± SD. Independent samples t-tests and one-way ANOVA were used for parameters with normal distribution, and the Mann-Whitney U and Kruskal Wallis tests were used for parameters with non-normal distribution. Categorical data were expressed as frequency and percentages and were analyzed using the chi-squared test or Fisher’s exact test, as appropriate. Ordinal logistic regression models were used to assess the association between stress and dietary intake, both unadjusted and adjusted for age, gender, marital status, occupation status, smoking status, physical activity, and the presence of chronic disease. A p-value of less than 0.05 (using a two-sided test) was considered statistically significant.
Results
Socio-demographic characteristics
The study included 541 participants, with the majority being female (93.3%) and only 6.7% male. The mean age of participants was 27 years. In terms of marital status, 66.7% were single, 29.9% married, and 3.3% divorced or widowed. Regarding education level, most participants held a bachelor’s degree (70.6%), while 17.2% had education below the university level; 7.6% had a master’s or Ph.D., and 4.6% had a diploma. For occupational status, the largest group was students (56.7%), followed by employed individuals (18.3%), unemployed participants (9.4%), housewives (10.7%), and smaller percentages in free business (1.8%) or retired (3%). A large proportion of participants (91.1%) did not suffer from any chronic disease, while 8.9% had chronic condition. The majority, 91.7%, were non-smokers, while 7.2% smoked and 1.1% had quit smoking. Regarding physical activity, 61.2% of participants were classed as not being physically active, while 38.8% regularly engaged in physical activity (Table 1).
Table 1: Socio-demographic characteristics of Participants
| Variables | Frequency | Percentage |
| Gender | ||
| Male | 36 | 6.7 |
| Female | 505 | 93.3 |
| Marital status | ||
| Single | 361 | 66.7 |
| Married | 162 | 29.9 |
| Divorced/widowed | 18 | 3.3 |
| Education Level | ||
| less than university | 93 | 17.2 |
| Diploma | 25 | 4.6 |
| Bacholar | 382 | 70.6 |
| Masters/ PhD | 41 | 7.6 |
| Occupation | ||
| Employed | 99 | 18.3 |
| Unemployed | 51 | 9.4 |
| Students | 307 | 56.7 |
| Free business | 10 | 1.8 |
| Retired | 16 | 3 |
| Housewife | 58 | 10.7 |
| Chronic disease | ||
| no chronic disease | 493 | 91.1 |
| with chronic disease | 48 | 8.9 |
| Smoking | ||
| Smoke | 39 | 7.2 |
| Non smoke | 496 | 91.7 |
| quit smoke | 6 | 1.1 |
| Physical activity | ||
| not physically active | 331 | 61.2 |
| physically active | 210 | 38.8 |
| Mean | SD | |
| Age | 27.16 | 9.52 |
| Perceived Stress score | 19.92 | 6.22 |
| Food addiction score | 17.37 | 15.30 |
The association between socio-demographic characteristics and stress level
The association between socio-demographic characteristics and stress levels is described in Table 2. The results indicate significant associations between several socio-demographic factors and stress levels. Individuals who are younger, unmarried, female, students and those with lower physical activity reported higher levels of stress. Age was inversely associated with stress, as younger participants showed higher stress levels (P < 0.001). Females showed higher stress levels compared to males (P < 0.001). Marital status and occupation also showed significant associations, with students and unmarried individuals experiencing higher stress (P = 0.001). Additionally, physically active individuals reported lower stress levels (P = 0.037). No significant associations were found between stress and education level, chronic disease status, or smoking behavior.
Table 2: The association between socio-demographic characteristics and stress level
| Low stress | Moderate stress | High perceived stress | Total | P-value | |
| Age | Mean | Mean | Mean | Total | <0.001 a |
| 32 ± 13 | 27 ± 9 | 24 ± 6 | 27 ± 10 | ||
| Gender | |||||
| Male | 14 (38.9%) | 20 (55.6%) | 2 (5.6%) | 36 (100%) | <0.001b |
| Female | 61 (12.1%) | 373 (73.9%) | 71 (14.1%) | 505 (100%) | |
| Marital status | |||||
| Single | 35 (9.7%) | 270 (74.8%) | 56 (15.5%) | 361 (100%) | 0.001c |
| Married | 34 (21%) | 114 (70.4%) | 14 (8.6%) | 162 (100%) | |
| Divorced | 6 (33.3%) | 9 (50%) | 3 (16.7%) | 18 (100%) | |
| Education Level | |||||
| less than university | 15 (16.1%) | 69 (74.2%) | 9 (9.7%) | 93 (100%) | 0.189 b |
| Diploma | 5 (20%) | 17 (68%) | 3 (12%) | 25 (100%) | |
| Bachelor | 45 (11.8%) | 279 (73%) | 58 (15.2%) | 382 (100%) | |
| Masters/ PhD | 10 (24.4%) | 28 (68.3%) | 3 (7.3%) | 41 (100%) | |
| Occupation | |||||
| Employed | 22 (22.2%) | 70 (70.7%) | 7 (7.1%) | 99 (100%) | <0.001c |
| Unemployed | 6 (11.8%) | 41 (80.4%) | 4 (7.8%) | 51 (100%) | |
|
Students |
25 (8.1%) | 230 (74.9%) | 52 (16.9%) | 307 (100%) | |
| Free business | 1 (10%) | 8 (80%) | 1 (10%) | 10 (100%) | |
| Retired | 8 (50%) | 7 (43.8%) | 1 (6.3%) | 16 (100%) | |
| Housewife | 13 (22.4%) | 37 (63.8%) | 8 (13.8%) | 58 (100%) | |
| Chronic disease | |||||
| No chronic disease | 66 (13.4%) | 358 (72.6%) | 69 (14%) | 493 (100%) | 0.378b |
| with chronic disease | 9 (18.8%) | 35 (72.9%) | 4 (8.3%) | 48 (100%) | |
| Smoking | |||||
| Smoke | 4 (10.3%) | 28 (71.8%) | 7 (17.9%) | 39 (100%) | 0.303 c |
| Non smoke | 71 (14.3%) | 359 (72.4%) | 66 (13.3%) | 496 (100%) | |
| quit smoke | 0 (0%) | 6 (100%) | 0 (0%) | 6 (100%) | |
| Physical activity | |||||
| not physically active | 38 (11.5%) | 241 (72.8%) | 52 (15.7%) | 331 (100%) | 0.037 b |
| physically active | 37 (17.6%) | 152 (72.4%) | 21 (10%) | 210 (100%) | |
| Data are mean ± SD for continuous variables and n and n% for categorical.
a P-value is for one-way ANOVA b P-value is for Chi-square test c P-value is for Fisher’s exact test |
|||||
Association between stress levels and dietary intake
The analysis of dietary intake across different reported levels of stress reveals several significant associations, as shown in Table 3. Individuals with high perceived stress consumed more soft drinks (0.52 ± 0.8) compared to those with low (0.26 ± 0.48) or moderate stress (0.35 ± 0.61), with a significant difference (P = 0.033). Similarly, consumption of energy drinks was higher among those with high stress (0.14 ± 0.44) compared to those with low (0.06 ± 0.3) and moderate stress (0.08 ± 0.26), with significant difference (P = 0.044). On the other hand, participants with low stress had a higher intake of nuts (0.38 ± 0.55), vegetables (0.89 ± 1.04), and fruits (0.83 ± 0.95) compared to those with moderate or high stress (P < 0.001, P = 0.006, and P < 0.001, respectively). However, no significant differences were observed for savory snacks, sweet snacks, or fast-food consumption across stress levels.
Table 3: Association Between Stress Levels and Dietary Consumption
| Low stress (n=75) | Moderate stress (n=393) | High perceived stress (n=73) | Total (n=541) | P-value | |
| Soft Drinks | 0.26 ± 0.48 a | 0.35 ± 0.61 a,b | 0.52 ± 0.8 b | 0.36 ± 0.62 | 0.033 |
| Energy Drinks | 0.06 ± 0.3 | 0.08 ± 0.26 | 0.14 ± 0.44 | 0.09 ± 0.29 | 0.044 |
| Nuts | 0.38 ± 0.55 a | 0.27 ± 0.58 a | 0.17 ± 0.38 b | 0.27 ± 0.55 | <0.001 |
| Vegetables | 0.89 ± 1.04 a | 0.68 ± 0.81 a | 0.58 ± 0.88 b | 0.69 ± 0.86 | 0.006 |
| Fruits | 0.83 ± 0.95 a | 0.5 ± 0.65 b | 0.37 ± 0.77 c | 0.53 ± 0.73 | <0.001 |
| Savory snacks | 0.2 ± 0.38 | 0.23 ± 0.36 | 0.24 ± 0.4 | 0.23 ± 0.37 | 0.533 |
| Sweet snacks | 1.29 ± 1.23 | 1.15 ± 1.05 | 1.13 ± 1.31 | 1.17 ± 1.11 | 0.471 |
| Fast food | 1.09 ± 1.09 | 1.25 ± 1.14 | 1.25 ± 1.03 | 1.23 ± 1.12 | 0.367 |
Association between levels of food addiction and dietary intake
Significant associations were observed between levels of food addiction and dietary intake of certain foods. Participants with severe food addiction reported higher consumption of soft drinks (0.53 ± 0.81) and energy drinks (0.08 ± 0.20), with statistical significance (P = 0.033 and P = 0.044, respectively). In contrast, individuals with no food addiction had the highest intake of vegetables (0.70 ± 0.86; P = 0.006), fruits (0.54 ± 0.66; P < 0.001), and nuts (0.26 ± 0.58; P < 0.001), while those with severe food addiction showed a decrease in fruit consumption (0.36 ± 0.55) (P < 0.001). While no significant differences were found for savory snacks, sweet snacks, or fast food, their consumption tended to be higher among those with higher levels of food addiction (Table 4).
Table 4: Association Between Levels of Food Addiction and Dietary Consumption
| No Food Addiction (n= 310) | Mild Food Addiction (n=117) | Moderate Food Addiction (n=49) | Severe Food Addiction (n=65) | P-value | |
| Soft drinks | 0.26 ± 0.46 | 0.5 ± 0.84 | 0.4 ± 0.57 | 0.53 ± 0.81 | 0.033 |
| Energy drinks | 0.08 ± 0.31 | 0.07 ± 0.18 | 0.19 ± 0.44 | 0.08 ± 0.20 | 0.044 |
| Nuts | 0.26 ± 0.58 | 0.29 ± 0.44 | 0.24 ± 0.42 | 0.3 ± 0.67 | <0.001 |
| Vegetables | 0.70 ± 0.86 | 0.72 ± 0.73 | 0.61 ± 1 | 0.66 ± 0.94 | 0.006 |
| Fruits | 0.54 ± 0.66 | 0.59 ± 0.83 | 0.56 ± 1.01 | 0.36 ± 0.55 | <0.001 |
| Savory snacks | 0.17 ± 0.25 | 0.28 ± 0.49 | 0.24 ± 0.3 | 0.39 ± 0.55 | 0.533 |
| Sweet snacks | 1.03 ± 0.99 | 1.17 ± 1.13 | 1.53 ± 1.25 | 1.56 ± 1.34 | 0.471 |
| Fast food | 1.08 ± 1.04 | 1.35 ± 1.14 | 1.51 ± 1.14 | 1.52 ± 1.3 | 0.367 |
The association between food addiction levels and perceived stress
The results demonstrated a significant association between food addiction levels and perceived stress among participants. In the low-stress group, 80% reported no food addiction, with only minor proportions experiencing mild (9.3%), moderate (6.7%), or severe (4%) food addiction. A strong inverse correlation was found between food addiction and low stress (ꭕ² = 38.113, P < 0.001). In contrast, among those with moderate stress, the percentage of individuals without food addiction decreased to 56.7%, while the percentage of mild (23.9%), moderate (8.4%), and severe (10.9%) food addiction increased. The high-stress group revealed a further increase in food addiction levels, with only 37% reporting no food addiction, while mild (21.9%), moderate
(15.1%), and severe (26%) food addiction rates increased significantly (Figure 1 and Table 5).
Table 5: The association between food addiction levels and perceived stress
| No Food Addiction (n= 310) | Mild Food Addiction (n=117) | Moderate Food Addiction (n=49) | Severe Food Addiction (n=65) | P-value | |
| Low stress (n=75) | 60 (80%) | 7 (9.3%) | 5 (6.7%) | 3 (4%) |
ꭕ2 = 38.113 P<0.001 |
| Moderate stress (n=393) | 223 (56.7%) | 94 (23.9%) | 33 (8.4%) | 43 (10.9%) | |
| High perceived stress (n=73) | 27 (37%) | 16 (21.9%) | 11 (15.1%) | 19 (26%) |
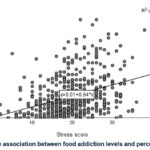 |
Figure 1: The association between food addiction levels and perceived stress |
Effect of stress levels on food intake (unadjusted and adjusted models)
Associations between stress levels and dietary intake, specifically focusing on soft drinks, energy drinks, nuts, vegetables, and fruits, with models both unadjusted and adjusted for potential confounding factors, are presented in Table 5. For soft drinks, individuals experiencing high stress showed a significant increase in consumption (unadjusted estimate: 0.758, P = 0.01), although the adjusted estimate did not show a significant difference (0.534, P = 0.083). For energy drinks, both moderate (0.705, P = 0.024) and high (0.902, P = 0.017) levels of stress were associated with increased consumption, but adjustments weakened the association for each. In terms of nuts, moderate stress was associated with decreased consumption (unadjusted estimate: -0.465, P = 0.038), while high stress led to a significant reduction (-1.18, P < 0.001), which remained significant after adjustments (-0.881, P = 0.005). For vegetables, high stress was linked to a significant decrease in consumption (-0.964, P = 0.001), and this remained significant after adjustment (-0.835, P = 0.006). Fruit also showed a notable decrease in intake with increasing stress levels, with both moderate and high stress associated with significant reductions (unadjusted: -0.812, P < 0.001; high stress: -1.453, P < 0.001), which remained significant in the adjusted model. No significant associations were found for savory snacks, sweet snacks, or fast-food consumption.
Table 6: Effect of Stress Levels on Food Intake (Unadjusted and Adjusted Models)
| Unadjusted Estimate (95% CI); p-value | Adjusted Estimate (95% CI); p-value | |
| Soft drinks | ||
| Low stress | Reference | Reference |
| Moderate stress | 0.255 (-0.186, 0.695); 0.258 | 0.215 (-0.246, 0.677); 0.36 |
| High stress | 0.758 (0.184, 1.331); 0.01 | 0.534 (-0.069, 1.136); 0.083 |
| Energy drinks | ||
| Low stress | Reference | |
| Moderate stress | 0.705 (0.094, 1.316); 0.024 | 0.521 (-0.128, 1.17); 0.116 |
| High stress | 0.902 (0.163, 1.641); 0.017 | 0.489 (-0.296, 1.273); 0.222 |
| Nuts | ||
| Low stress | Reference | |
| Moderate stress | -0.465 (-0.904, -0.026); 0.038 | -0.22 (-0.676, 0.236); 0.345 |
| High stress | -1.18 (-1.765, -0.595); <0.001 | -0.881 (-1.492, -0.269); 0.005 |
| Vegetables | ||
| Low stress | Reference | |
| Moderate stress | -0.403 (-0.84, 0.033); 0.07 | -0.345 (-0.799, 0.109); 0.136 |
| High stress | -0.964 (-1.537, -0.392); 0.001 | -0.835 (-1.435, -0.235); 0.006 |
| Fruits | ||
| Low stress | Reference | |
| Moderate stress | -0.812 (-1.252, -0.372); <0.001 | -0.716 (-1.172, -0.259); 0.002 |
| High stress | -1.453 (-2.034, -0.873); <0.001 | -1.298 (-1.904, -0.691); <0.001 |
| Savory snacks | NS | NS |
| Sweet snacks | NS | NS |
| Fast food | NS | NS |
| NS: Not significant.
Unadjusted model: Estimates are unadjusted for potential confounding factors. Adjusted model: Estimates are adjusted for age, gender, marital status, job status, smoking status, physical activity, and presence of chronic disease. |
||
Discussion
This study provides evidence regarding the association between perceived stress levels, food addiction, and food intake among adults in Saudi Arabia. Perceived stress was positively correlated with several socio-demographic factors. Younger, unmarried individuals, females, students, and those with lower physical activity all reported higher levels of stress. The results also indicate that higher stress levels are associated with decreased consumption of healthier options like nuts, vegetables, and fruits after adjusting for potential confounders. In addition, a significant association was found between food addiction levels and perceived stress among participants in the high-stress group, revealing a further increase in food addiction levels with high stress.
In terms of gender, the results found that women had a higher level of perceived stress than men, supporting the findings of previous studies, which have also found that women have higher levels of stress compared to men 21-23. It has been proposed that while men often exhibit a “fight-or-flight” response to stress, women are more likely to engage in “tend-and-befriend” behaviors. This could result in men and women responding differently to stress, both psychologically and biologically 24. Regarding occupation, the presented results showed that students were more likely to experience high levels of perceived stress. This finding is also consistent with numerous studies conducted among university students 25-27. Among students, differences in perceived stress levels have been observed based on gender, with female students reporting significantly higher total PSS levels compared to their male counterparts 28. A study by Brougham, Zail, Mendoza, and Miller also found that stress levels were higher in female students compared to others 29. The results in this study also indicated that physically inactive participants were significantly more likely to report higher perceived stress compared to their physically active counterparts, similar to previous reports conducted in Germany and the USA 30,31.
In the current study, higher stress levels were associated with increased consumption of soft and energy drinks and decreased consumption of healthier food options like nuts, vegetables, and fruits. These findings are consistent with other studies that show a relationship between mental health problems and high sugar intake 32,33. Numerous studies have also reported that stress influences food intake and changes dietary behaviors 34,35. Studies have suggested that stress leads individuals to eat when they are not hungry and choose energy-dense foods, likely due to activity in the brain’s reward system 34,35. Consistent with the current findings, many studies have previously confirmed that perceived stress leads to more snacking and consumption of high-calorie foods, while reducing fruit and vegetable intake 36-39.
The results in the current study also showed a negative association between perceived stress and a preference for healthy dietary options, such as fruits, vegetables, and nuts; these effects were maintained after adjusting for potential confounders, including age, gender, marital status, job status, smoking status, physical activity, and presence of chronic disease. These findings are in line with those of previous studies, which indicate that elevated stress levels are associated with decreased consumption of fruits and vegetables 36-38. Overall, the current findings and those of multiple previous studies indicate that stress is positively associated with emotional eating, frequent snacking, and the consumption of energy-dense foods, while being negatively associated with the intake of fruits and vegetables36-38.
This study also showed that higher levels of food addiction are linked to less healthy dietary choices, particularly increased intake of sugary beverages and reduced consumption of fruits and vegetables. This aligns with previous research, which has demonstrated that food addiction is associated with the consumption of less healthy foods, including soft drinks, while high vegetable consumption is associated with a decreased risk of severe food addiction 40. The present research highlights a complex relationship between food addiction behaviors and unhealthy dietary patterns.
Finally, the study found a significant association between perceived stress and food addiction; as perceived stress increases, the possibility of experiencing food addiction rises with it. These findings aligned with previous research show a significant positive correlation between psychological distress and symptoms of food addiction 21,22,41. This suggests a possible relationship between psychological stress and unhealthy eating behaviors.
The present study is one of the few to examine the association between perceived stress levels, food addiction, and food intake among adults in Saudi Arabia. However, it has several limitations. First, the cross-sectional design does not permit deduction of causality. Second, there may be selection bias in those who completed the online survey, which limits the generalizability of the findings. Finally, body mass index (BMI) was not considered as a variable; BMI is closely associated with stress, eating behaviors, and food addiction. This omission limits the ability to fully understand the relationship between perceived stress, food addiction, and food intake in these results.
Conclusion
This study revealed significant associations between perceived stress levels, food addiction, and dietary intake among adults in Saudi Arabia. To better understand these relationships, future research should utilize longitudinal designs. The findings from this study offer important insights, suggesting the importance of future research examining the impact of stress on food addiction and food consumption. Foods that may help alleviate stress should be investigated to enable individuals to adopt healthier eating behaviors as a coping strategy. Additionally, it is recommended to develop interventions aimed at helping adults manage stress through various techniques without turning to food addiction.
Acknowledgement
The authors would like to thank Dr. Sumia Enani for her invaluable contribution to data analysis in this study. Her expertise and insightful input significantly enhanced the quality and clarity of the findings.
Funding Sources
The authors received no financial support for the research, authorship, and/or publication of this article.
Conflict of Interest
The authors have no conflict of interest to declare.
Ethics Statement
The document accurately and thoroughly presents the authors’ original research and analysis.
Data Availability Statement
The manuscript incorporates all datasets produced or examined throughout this research study.
Informed Consent Statement
Informed consent was obtained from all participants involved in this study.
Permission to Reproduce Material from other Sources
Not applicable
Clinical Trial Registration
“This research does not involve any clinical trials.”
Author Contributions
- Huda Wazzan: Conceptualization, data curation, Methodology, Project administration, Writing – original draft & review & editing.
- Mahitab Hanbazaza: data curation, Methodology, Project administration, Formal analysis, Writing – original draft & review & editing.
References
- Jurema Santos GC, de Sousa Fernandes MS, Carniel PG, da Silva Garcez A, Gois Leandro C, Canuto R. Dietary intake in children and adolescents with food addiction: A systematic review. Addictive Behaviors Reports. Jun 2024;19:100531. doi:10.1016/j.abrep. 2024.100531
CrossRef - Corwin RL, Grigson PS. Symposium overview–Food addiction: fact or fiction? The Journal of Nutrition. Mar 2009;139(3):617-9. doi:10.3945/jn.108.097691
CrossRef - Lima VP, de Olivindo Cavalcante E, Leão MA, LaFata EM, Sampaio AM, Neto PRN. Reliability and validity of the modified Yale Food Addiction Scale 2.0 (mYFAS 2.0) in a sample of individuals with depressive disorders. Journal of Eating Disorders. 2024;12(1)doi:10.1186/s40337-024-01108-7
CrossRef - Avena NM, Rada P, Hoebel BG. Evidence for sugar addiction: behavioral and neurochemical effects of intermittent, excessive sugar intake. Neuroscience & Biobehavioral Reviews. 2008;32(1):20-39.
CrossRef - Mesas AE, Girotto E, Rodrigues R, Martínez-Vizcaíno V, Jiménez-López E, López-Gil JF. Ultra-Processed Food Consumption is Associated with Alcoholic Beverage Drinking, Tobacco Smoking, and Illicit Drug Use in Adolescents: A Nationwide Population-Based Study. International Journal of Mental Health and Addiction. 2023;doi:10.1007/s11469-023-01038-6
CrossRef - Gearhardt AN, Boswell RG, White MA. The association of “food addiction” with disordered eating and body mass index. Eating behaviors. 2014;15(3):427-433.
CrossRef - da Silva Junior AE, de Lima Macena M, de Oliveira ADS, et al. Prevalence of food addiction and its association with anxiety, depression, and adherence to social distancing measures in Brazilian university students during the COVID-19 pandemic: a nationwide study. Eat Weight Disord. Aug 2022;27(6):2027-2035. doi:10.1007/s40519-021-01344-9
CrossRef - Burrows T, Kay-Lambkin F, Pursey K, Skinner J, Dayas C. Food addiction and associations with mental health symptoms: a systematic review with meta-analysis. Journal of Human Nutrition and Dietetics. Aug 2018;31(4):544-572. doi:10.1111/jhn.12532
CrossRef - Horsager C, Faerk E, Lauritsen MB, Østergaard SD. Food addiction comorbid to mental disorders: A nationwide survey and register-based study. The International journal of eating disorders. Apr 2021;54(4):545-560. doi:10.1002/eat.23472
CrossRef - Mezdoud A, Bahchachi N, Bensalem A, Agli A-N, Achamrah N, Oulamara H. Chronic stress and food addiction, implications for food intake in Algerian adults. Nutrition Clinique et Métabolisme. 2024/06/01/ 2024;38(2):109-113. doi:https://doi.org/10.1016/j.nupar.2024.03.002
CrossRef - Hardy R, Fani N, Jovanovic T, Michopoulos V. Food addiction and substance addiction in women: Common clinical characteristics. Appetite. Jan 1 2018;120:367-373. doi:10.1016/j.appet.2017.09.026
CrossRef - Mitchell KS, Wolf EJ. PTSD, food addiction, and disordered eating in a sample of primarily older veterans: The mediating role of emotion regulation. Psychiatry research. Sep 30 2016;243:23-9. doi:10.1016/j.psychres.2016.06.013
CrossRef - McEwen BS. Protection and damage from acute and chronic stress: allostasis and allostatic overload and relevance to the pathophysiology of psychiatric disorders. Annals of the new York Academy of Sciences. 2004;1032(1):1-7.
CrossRef - Krueger PM, Chang VW. Being poor and coping with stress: health behaviors and the risk of death. American journal of public health. 2008;98(5):889-896.
CrossRef - Rodgers RF, Lombardo C, Cerolini S, et al. The impact of the COVID‐19 pandemic on eating disorder risk and symptoms. International Journal of Eating Disorders. 2020;53(7):1166-1170.
CrossRef - Berg Schmidt J, Johanneson Bertolt C, Sjödin A, et al. Does stress affect food preferences?–a randomized controlled trial investigating the effect of examination stress on measures of food preferences and obesogenic behavior. Stress. 2018;21(6):556-563.
CrossRef - Fawzi M, Fawzi M. Validation of an Arabic version of the Yale Food Addiction Scale 2.0. Eastern Mediterranean Health Journal. 2018;24(08):745-752. doi:10.26719/2018.24.8.745
CrossRef - Flood VM, Wen LM, Hardy LL, Rissel C, Simpson JM, Baur LA. Reliability and validity of a short FFQ for assessing the dietary habits of 2–5-year-old children, Sydney, Australia. Public Health Nutrition. 2013;17(3):498-509. doi:10.1017/s1368980013000414
CrossRef - Chaaya M, Osman H, Naassan G, Mahfoud Z. Validation of the Arabic version of the Cohen Perceived Stress Scale (PSS-10) among pregnant and postpartum women. BMC psychiatry. 2010;10:1-7.
CrossRef - Cohen S, Kamarck T, Mermelstein R. A global measure of perceived stress. Journal of health and social behavior. 1983:385-396.
CrossRef - Lin YS, Tung YT, Yen YC, Chien YW. Food Addiction Mediates the Relationship between Perceived Stress and Body Mass Index in Taiwan Young Adults. Nutrients. Jun 30 2020;12(7)doi:10.3390/nu12071951
CrossRef - Raymond K-L, Kannis-Dymand L, Lovell GP. A graduated food addiction classifications approach significantly differentiates depression, anxiety and stress among people with type 2 diabetes. Diabetes research and clinical practice. 2017;132:95-101.
CrossRef - Harding JL, Backholer K, Williams ED, et al. Psychosocial stress is positively associated with body mass index gain over 5 years: evidence from the longitudinal AusDiab study. Obesity. 2014;22(1):277-286.
CrossRef - Taylor SE, Klein LC, Lewis BP, Gruenewald TL, Gurung RA, Updegraff JA. Biobehavioral responses to stress in females: tend-and-befriend, not fight-or-flight. Psychological review. Jul 2000;107(3):411-29. doi:10.1037/0033-295x.107.3.411
CrossRef - Alsaleem MA, Alsaleem SA, Al Shehri S, et al. Prevalence and correlates of university students’ perceived stress in southwestern Saudi Arabia. Medicine. 2021;100(38):e27295.
CrossRef - Shaw MP, Peart DJ, Fairhead OJW. Perceived stress in university students studying in a further education college. Research in Post-Compulsory Education. 2017;22(3):442-452.
CrossRef - Fares J, Saadeddin Z, Al Tabosh H, et al. Extracurricular activities associated with stress and burnout in preclinical medical students. Journal of epidemiology and global health. 2016;6(3):177-185.
CrossRef - Deatherage S, Servaty-Seib HL, Aksoz I. Stress, coping, and internet use of college students. Journal of American College Health. 2014;62(1):40-46.
CrossRef - Brougham RR, Zail CM, Mendoza CM, Miller JR. Stress, sex differences, and coping strategies among college students. Current psychology. 2009;28:85-97.
CrossRef - VanKim NA, Nelson TF. Vigorous physical activity, mental health, perceived stress, and socializing among college students. American journal of health promotion. 2013;28(1):7-15.
CrossRef - Tan SL, Jetzke M, Vergeld V, Müller C. Independent and combined associations of physical activity, sedentary time, and activity intensities with perceived stress among university students: internet-based cross-sectional study. JMIR Public Health and Surveillance. 2020;6(4):e20119.
CrossRef - Lien L, Lien N, Heyerdahl S, Thoresen M, Bjertness E. Consumption of soft drinks and hyperactivity, mental distress, and conduct problems among adolescents in Oslo, Norway. American journal of public health. 2006;96(10):1815-1820.
CrossRef - Tosun M, Ersöz B, Ersoy N. The relationship of food addiction with carbohydrate intake and stress in adolescents. Gulhane Medical Journal. 2023;65(3)
CrossRef - Born JM, Lemmens SG, Rutters F, et al. Acute stress and food-related reward activation in the brain during food choice during eating in the absence of hunger. International journal of obesity. 2010;34(1):172-181.
CrossRef - Tariq S, Tariq S, Tariq S. Association of perceived stress with healthy and unhealthy food consumption among teenagers. J Pak Med Assoc. 2019;69(12):1817-1821.
CrossRef - Almajwal AM. Stress, shift duty, and eating behavior among nurses in Central Saudi Arabia. Saudi medical journal. 2016;37(2):191.
CrossRef - Roberts CJ, Campbell IC, Troop N. Increases in weight during chronic stress are partially associated with a switch in food choice towards increased carbohydrate and saturated fat intake. European Eating Disorders Review. 2014;22(1):77-82.
CrossRef - Tryon MS, Carter CS, DeCant R, Laugero KD. Chronic stress exposure may affect the brain’s response to high calorie food cues and predispose to obesogenic eating habits. Physiology & behavior. 2013;120:233-242.
CrossRef - Wardle J, Steptoe A, Oliver G, Lipsey Z. Stress, dietary restraint and food intake. Journal of psychosomatic research. 2000;48(2):195-202.
CrossRef - Burrows T, Hides L, Brown R, Dayas CV, Kay-Lambkin F. Differences in Dietary Preferences, Personality and Mental Health in Australian Adults with and without Food Addiction. Nutrients. Mar 15 2017;9(3)doi:10.3390/nu9030285
CrossRef - Kozak AT, Davis J, Brown R, Grabowski M. Are overeating and food addiction related to distress tolerance? An examination of residents with obesity from a US metropolitan area. Obesity research & clinical practice. 2017;11(3):287-298.
CrossRef

This work is licensed under a Creative Commons Attribution 4.0 International License.


