

Introduction
As a horticultural commodity, shallot (Allium cepa var. ascalonicum) has shown economic importance to Indonesia. Its derived product—fried shallot—has been commercially available in Indonesia, and often used as a food condiment to rice and noodles. The main producers of fried shallots located in Central Java, Central Sulawesi, West Java and Jakarta. Although fried shallots are popular in Indonesia, but their desirable sensory characteristics affecting consumer’s preference are less extensively researched. In practice, fried shallots are obtained from the frying process of sliced fresh shallots with high moisture content using vegetable oils as frying medium with or without the addition of salt, seasoning and/or flour. Aroma and taste of fried shallots are developed during frying along with a browning reaction. Fried shallots are mostly described to have a gold brown to dark color and crisp characteristics. However, to know the precise desirable product quality and quantitative sensory characteristics of fried shallots, an effort should be scientifically performed. A survey on consumer preference to a desirable product quality followed by a sensory evaluation by a panel on commercial products may be useful to reveal the aspects of fried shallot sensory characteristics.
In order to uncover sensory attributes of a product, data collection using survey method could be employed, as previously conducted in meat products1, meat substitution products2 and smoothies.3 As reported by Ardeshiri and Rose,1 consumer perceptions to the attributes of meat product in Australia could be attempted through online surveys. An online survey was also conducted by Elzerman et al.2 towards sensory acceptance and preference for meat substitution products. In both mentioned studies, the sensory attributes were selected, enabling respondents to assess them via visual information. This present research is the first investigation on consumer perceptions of the fried shallot sensory attributes carried out using online survey method.
Consumer perceptions of this sensory attribute can be confirmed by using the sensory analysis of the rate-all-that-apply (RATA) method. It constitutes a sensory description method using untrained panelists, as conducted by former researchers in chocolate products,4 wine,5,6 emulsion models,7 apples, pineapple, peanuts, raspberry, fruitcake and orange-flavored drinks,8 milk, bread, sweets and yogurt.9 The RATA method is suitable for obtaining sensory descriptions of a product based on consumer perceptions, because this method uses untrained panelists and requires a short time in testing. Product acceptance by consumers can be obtained by the hedonic method with a point scale, the statistical test that is suitable is the analysis of variance (ANOVA) method.10 Hedonic test procedures have been carried out on various types of food products. Hedonic tests can be used to determine overall acceptance of sheep meat coppa that have different sensory characteristics.11 Product acceptance using hedonic tests has also been carried out on the effect of frozen storage on the development of prebiotic ice cream product12 and on the parboiling process of glutinous brown rice products in retort pouch.13
The purpose of this study was to investigate the consumer perception to sensory attributes of fried shallots based on online survey method and its confirmation using sensory evaluation of commercial fried shallots. Differentiation of commercial fried shallots based on the sensory results was also studied.
Materials and Methods
Materials
In online questionnaire, we displayed 3 commercial fried shallot images, collected from different manufacturers: Palu or Central Celebes, Rubaru variety (produced in Jakarta), and Brebes variety (produced in Jakarta). For sensory confirmation, 5 samples were given, i.e. bought from Palu (PAL), traditional markets on Semarang-Central Java (SEM), two samples from Jakarta (SUM and BRE), and Cirebon-West Java (CIR). Samples bought from Jakarta were made from shallot varieties of Brebes (BRE) and Rubaru (SUM). The samples for sensory evaluation are presented 1 g each in plastic with the size of 4 × 6 cm.
Survey Method for Consumer Perception
Respondents
The survey method is used to determine consumer perceptions of desirable fried shallot products. The questionnaire was distributed online using Google form for a week from May 14th to 20th, 2018. Respondents were randomly selected, while the number of respondents was calculated according to Krejcie and Morgan formula14 as follows:
S = X2NP (1-P) / d2 (N-1) + X2 P (1-P)
where S is number of respondents; N is population; P is population proportion (0.5); d is accuracy level (0.05); and X2 is table value X2 (3.84).
Questionnaire
The questionnaire was developed to obtain the sensory attributes of desirable fried shallot characteristics. These attributes included taste, aroma, color, and texture. Questionnaire development was carried out by interviewing consumers (9 respondents, aged 30-45 years old) directly. The respondents were asked to mention the sensory attributes in some samples of commercial fried shallots (3 different products with various qualities) that were served directly (by blind sample method). The sensory attributes were identified after the respondents observed visually and tasted all samples. These attributes were used for online questionnaire.
The online questionnaire was divided into two parts. The first part described profile of respondents (age, sex, education, city of residence and consumption frequency). The second part consisted of consumer perceptions in consuming fried shallots, consumption frequency, consumer perceptions related to shapes (whole or slices) and visual colors (brown, golden brown, brownish-white), and consumer perceptions on sensory attributes (savory taste, sweet taste, salty taste, bitter taste, fragrant sulfury aroma, sweet aroma, rancid aroma, and crispness) of a high quality fried shallot. The 5-points (1 to 5) intensity scale was applied, i.e. very weak, weak, moderate, strong, and very strong, respectively. In color attribute, three choices of fried shallot images representing commercial products were given to respondents. Respondents were also asked to mention their recognition to a place which become a central of fried shallot industries, with an open answer question.
The questionnaire was then performed pretest and measured its validity and reliability. In the pretest, only the nominal questions were tested. Ordinal questions were tested for validity and reliability. The validity was evaluated using product moment correlation formula indicated by the r value. If the r value was equal or greater than the table value, the question tested was confirmed as valid.
Product moment correlation formula was given as follows:
where X is score on the question you want to test; Y is score from each question; N is number of observations; r is index of validity
Data Analysis
Statistical analysis of data was carried out using Microsoft Excel 2010 for Windows 7 (Microsoft, USA).
Confirmation of Consumer Perception by Sensory Evaluation
RATA Analysis
The sensory descriptors used for RATA analysis on commercial fried shallots were developed from the survey results. The sensory attributes were brown color, fragrant sulfury aroma, sweet aroma, rancid aroma, savory taste, sweet taste, salty taste, bitter taste and crispness. Five fried shallot commercial products were tested to 101 untrained panelists (37% males, 63% females) aged 19 – 53 years old. Face-to-face briefing was carried out to describe measurement method for each sensory attribute. Each panelist was asked to assess the intensities of the sensory attributes of each sample by visual, sniff and taste evaluation.4 The 6-points numerical scale (0 to 5) was used for describing level of intensity: not detected, very weak, weak, moderate, strong, very strong, respectively, following the evaluation conducted by.9 Palate cleansers (water and bread) were provided for panelists to eat between tested samples to prevent carryover tastes. Data from RATA test were analyzed using spider web diagram.
Hedonic rating test15
The acceptance of 5 commercial fried shallots was evaluated using hedonic rating method. A total of 101 untrained panelists were asked to describe their preference on sample attributes (color, aroma, taste, texture, overall) using 7-points scale (1 strongly disliked to 7 very like). Noticeably, panelists were asked not to compare samples. Hedonic score data were analyzed statistically by one way ANOVA using SPSS 22 (IBM, USA). Tukey’s test was used for pos hoc experimental statistic analysis. Data from hedonic and RATA test were compared to survey results.
Differentiation of Commercial Fried Shallots
Differentiation of five commercial fried shallots was performed by principal component analysis (PCA) in XLSTAT 2016 based on the average value of the RATA and hedonic scores.
Results and Discussion
Respondent Profile
The survey was conducted online to 525 respondents. The detail characteristics of respondents are presented in Table 1. In general, respondents were dominated by women (67%), ranging at 19 – 29 years old (72%), with education level of undergraduate student (60.4%). The respondents were also considered to represent Indonesian population from six major islands as shown in Table 1. Respondents are mostly from Java (85%), while the frequency of consuming fried shallot was sometimes (55%), often (27%) and rarely (17.9% ).
Table 1: Profile of respondents involved in the research of consumer perceptions of fried shallots
| Information | Number of respondents (%) | |
| Sex | Female | 67 |
| Male | 33 | |
| Age | 13-18 | 1.3 |
| 19-29 | 72.0 | |
| 30-39 | 16.8 | |
| 40-49 | 5.7 | |
| 50-59 | 3.8 | |
| 60-69 | 0.2 | |
| 70-79 | 0.2 | |
| Education | S2/more | 11.4 |
| Diploma IV/University (S1) | 60.4 | |
| Diploma III | 5.5 | |
| Diploma I/II | 1.3 | |
| BC Vocational | 17.9 | |
| High school/equivalent | 1.7 | |
| Middle school/equivalent | 1.0 | |
| Elementary/equivalent | 0.4 | |
| Not yet/no school | 0.4 | |
| Demographics | Sumatra | 6.1 |
| Java-Bali | 85.0 | |
| Borneo | 1.5 | |
| Sulawesi | 2.7 | |
| Sumbawa-Nusa Tenggara | 3.6 | |
| Papua | 1.1 | |
Fried Shallot Quality Desirable by Consumers
Fried shallot was manufactured through several stages of processing: sorting, washing, slicing, and frying. Some producers mixed fresh shallot with wheat flour prior to frying.16 Taste and aroma attributes of fried shallot included pungent taste, savory taste, sweet taste, bitter taste, roasted aroma, brothy aroma and sulfury aroma as reported by Nugraheni (2004).
Consumer perceptions is a crucial element in making decision to buy a product; therefore, the picture of quality is needed in accordance with consumer expectation. Table 2 presented the response of respondents to physical characteristics of the fried shallots. The results indicated that 80.4% of respondents preferred uncoated fried shallots. Coated fried shallot was common in Indonesia, but it seemed to be less preferrable (19.6% of respondents). The coating material on the product surface remarkably affected sensory quality. Frying products that have been coated with a coating can reduce the overall acceptance of the product, for example in french fries.17 Regarding to color variations (brown, golden-brown and brownish-white), the golden-brown fried shallot seemed to be most desirable, reaching up to 84.0% of respondents. Color is a key factor that indicates the frying degree. The higher brown intensity may indicate that the product is sufficiently cooked, even tends to be over-cooked. The processing sufficiency noticeably affected sensory attributes, closely relating to bitter taste. Bitter taste is one of the undesirable qualities obtained from the excess Maillard reaction in the frying process.18 The shape of fried shallots may present in a whole slices or broken-piece slices. The results showed that 64.2% of respondents more preferred whole slices, while only 35.8% of respondents preferred broken pieces-shaped fried shallots. It is noteworthy that slicing quality remarkably contributes to consumer preference.
The assessment of sensory characteristics of fried shallots (taste, aroma and texture) was given in Table 3. The results showed that crispness (91.3%), savory taste (78.1%), and fragrant sulfury aroma (73.9%) constituted strong attributes affecting respondent acceptance. These attributes may be a key indicator of consumer perceptions. The key indicator turns out to represent the attributes of taste, aroma and texture. Interestingly, the salty, sweet taste, and sweet aroma attributes were less dominant for respondent interest (41.1% – 50.1% of total respondents), recorded as moderate intensity for this attribute.
Table 2: Physical characteristics of fried shallots according to the perception of respondents
| Physical Characteristics | Number of respondents perceiving desirable characteristics (%) | |
| Variant | Uncoated | 80.4 |
| Coated | 19.6 | |
| Color | Brown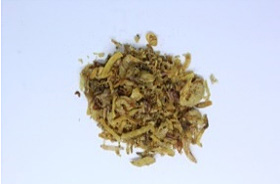 |
11.2 |
Golden brown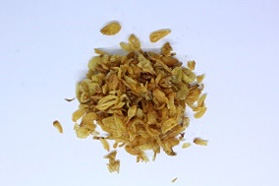 |
84.0 | |
Brownish white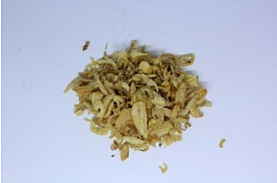 |
4.8 | |
| Form | Whole slice | 64.2 |
| Broken piece | 35.8 | |
Table 3: The sensory attributes of fried shallots according to the perceptions of respondents who consumed
| Attributes | Number of respondents (%) | ||||
| 1 | 2 | 3 | 4 | 5 | |
| Savory taste | 0.4 | 2.3 | 19.2 | 46.1 | 32.0 |
| Sweet taste | 15.4 | 29.3 | 41.5 | 11.8 | 1.9 |
| Salty taste | 7.4 | 16.6 | 50.1 | 23.2 | 2.7 |
| Bitter taste | 43.0 | 32.4 | 19.0 | 5.0 | 0.6 |
| Fragrant sulfury aroma | 1.3 | 3.2 | 21.5 | 44.2 | 29.7 |
| Sweet aroma | 13.9 | 24.4 | 41.1 | 16.8 | 3.8 |
| Rancid aroma | 81.3 | 14.5 | 2.5 | 1.5 | 0.2 |
| Crispness | 0.6 | 0.2 | 8.0 | 30.9 | 60.4 |
Note : score 1: very weak; 2: weak; 3: moderate; 4: strong; 5: very strong
The rancid aroma and bitter taste were preferred to be at weak intensity (95.8% and 75.4% of respondents). These attributes become the limiting attributes that can influence the product’s interest by consumers. Bitter taste usually resulted from frying process, while rancid aroma was produced from fat oxidation.
Differentiation of Commercial Fried Shallots
The sensory attributes of commercial fried shallots were obtained using sensory evaluation with RATA method. Five commercial fried shallots in this research were PAL (bought from Palu, Central Celebes), SEM (Semarang, Central Java), SUM (Jakarta, Sumenep variety of shallot), BRE (Jakarta, Brebes variety of shallot), and CIR (Cirebon, West Java). In this work, BRE is presented as the example of fluor coated fried shallots.
Based on the results, we found noticeable differences in sensory attributes between types of commercial fried shallots. In terms of color, the highest rank was attributed to PAL, SEM, and CIR samples (Figure 1). They appeared as brown in color with significantly different rating scores (Figure 1). According to the survey, the most preferrable color was golden brown, found in PAL, SEM, and CIR samples, with an intensity score of 2.20 – 4.15. BRE sample showed the lowest acceptance score, although the score did not differ compared to SEM sample. The disadvantage of BRE sample comes from its poor color uniformity. In this part, we reported that color homogeneity may crucially affect the consumer preference as MacDougall (2003)19 states that uniformity is important in food appereance.
The desirable aroma of fried shallot based on online survey was fragrant sulfury aroma at high level, sweet aroma at medium level, and rancid aroma at low level. In this study, such composition of aroma was found in CIR sample. These results confirm consumers’ perceptions of the desired attributes of fried shallots, shown by the diagram of the hedonic test results (Figure 2). In addition, although the level of fragrant sulfury and sweet aroma in SEM sample was not significantly different from CIR sample, it had higher rancid intensity, leading to reduction of its acceptance. These results are in line with Kitpot et al., (2019),20 an increase score of rancidity in the descriptive sensory test resulted in a decrease in the product acceptance. We also reported that the most desirable taste was attributed to CIR sample. It had high intensity of savory, sweet, salty and bitter taste in accordance with the consumer potential based on the survey results. The high intensity of savory taste leads CIR sample to be the most preferred one in comparison BRE sample possessing the lowest preference score due to the highest intensity of bitter taste. This current work also found that crispness positively related to preference score. Kitpot et al., (2019)20 also found that high crispness resulted in increased acceptance of the texture of fried product.
Based on RATA result (Figure 3A), components of PC1 and PC2 represented 95.24% of the total diversity of data. In terms of PC1, the attributes are separated mainly based on key attributes on positive x axis, i.e. fragrant sulfury aroma, savory taste and crispness. The limiting attribute or undesirable attribute lies in the negative x axis, mainly attributed to rancid aroma and bitter taste. The five products were spread in the four PCA quadrants, suggesting that each product demonstrates unique variations and characteristics. This PCA result demonstrated that different types of products by their varieties and origins also differred with regard to their physico-chemical characteristics. Figure 3A showed that CIR sample had desirable sensory attributes by consumers which is savory taste, while BRE sample (example of coated fried shallot) had undesirable sensory attributes.
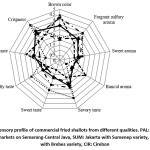 |
Figure 1: Sensory profile of commercial fried shallots from different qualities. PAL: Palu, SEM: traditional markets on Semarang-Central Java, SUM: Jakarta with Sumenep variety, BRE: Jakarta with Brebes variety, CIR: Cirebon Click here to View figure |
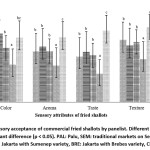 |
Figure 2: Sensory acceptance of commercial fried shallots by panelist. Different letter on bar indicate significant difference (p < 0.05). PAL: Palu, SEM: traditional markets on Semarang-Central Java, SUM: Jakarta with Sumenep variety, BRE: Jakarta with Brebes variety, CIR: Cirebon Click here to View figure |
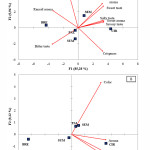 |
Figure 3: PCA biplot of RATA scores (A) and hedonic scores (B) of fried shallots from different qualities. PAL: Palu, SEM: traditional markets on Semarang-Central Java, SUM: Jakarta with Sumenep variety, BRE: Jakarta with Brebes variety, CIR: Cirebon Click here to View figure |
In Figure 3B, based on hedonic result, PC1 and PC2 illustrated 98.23% of total data. Based on Figure 3B, CIR sample was preferred because of its aroma, texture and taste. The CIR sample has a high intensity of savory taste, fragrant sulfury aroma and crispness (Figure 1), these result confirms consumer perceptions of the characteristics of desirable fried shallots (Table 3). The dominant sensory attributes contained in the BRE sample are bitter taste and rancid aroma (Figure 1). In Figure 3B, BRE is not characterized by any hedonic attributes, these results also confirm consumer perceptions that fried shallots with high bitter taste and rancid aroma tend not desired (Table 3).
Conclusion
Sensory attributes found in fried shallots are brown-color, fragrant sulfury aroma, sweet aroma, rancid aroma, savory taste, sweet taste, salty taste, bitter taste, and crispness. The desirable fried shallot according to consumers based on online surveys have physical characteristics were golden-brown, uncoated flour, and whole slices-shaped. Sensory characteristics desirable in fried shallots were high intensity of savory taste, fragrant sulfury aroma and crispness. These three sensory attributes served as the major indicators determining quality of fried shallots according to consumer perceptions. The bitter taste and rancid aroma constituted undesirable attributes on consumer preferences. An attempt to improve desirable attributes and reduce limiting attributes is neccessary to produce better sensory quality of fried shallots.
Acknowledgement
The authors acknowledged the Ministry of Research, Technology, and Higher Education Indonesia for providing research funding through PMDSU scholarship. Grant number 330/SP2H/LT/DRPM/IX/2016.
Funding
The author(s) received no financial support for the research, authorship, and/or publication of this article.
Conflict of Interest
The authors do not have any conflict of interest.
References
- Ardeshiri A, Rose JM. How Australian consumers value intrinsic and extrinsic attributes of beef products. Food Qual Prefer. 2017;65:146-163. doi:10.1016/j.foodqual.2017.10.018
- Elzerman JE, Hoek AC, Boekel MJAS Van, Luning PA. Appropriateness, acceptance and sensory preferences based on visual information: A web-based survey on meat substitutes in a meal context. Food Qual Prefer. 2015;42:56-65. doi:10.1016/j.foodqual.2015.01.010
- McCartney D, Rattray M, Desbrow B, Khalesi S, Irwin C. Smoothies : Exploring the Attitudes, Beliefs and Behaviours of Consumers and Non-Consumers. Curr Res Nutr Food Sci. 2018;06(2):425-436. doi:10.12944/CRNFSJ.6.2.17
- Waehrens SS, Zhang S, Hedelund PI, Petersen MA, Byrne D V. Application of the fast sensory method ‘ Rate-All-That-Apply ’ in chocolate Quality Control compared with DHS-GC-MS. Int J Food Sci ant Technol. 2016;51:1877-1887. doi:10.1111/ijfs.13161
- Franco-Luesma E, Saenz-Navajas M-P, Valentin D, Ballester J, Rodrigues H, Ferreira V. Study of the effect of H2S, MeSH and DMS on the sensory profile of wine model solutions by Rate-All-That-Apply (RATA). Food Res Int. 2016;87:152-160. doi:10.1016/j.foodres.2016.07.004
- Danner L, Crump AM, Croker A, Gambetta JM, Johnson TE, Bastian SEP. Comparison of Rate-All-That-Apply ( RATA ) and Descriptive Analysis ( DA ) for the Sensory Profiling of Wine. Am J Enol Vitic. 2017:1-29. doi:10.5344/ajev.2017.17052
- Oppermann AKL, Graaf C De, Scholten E, Stieger M, Piqueras-fiszman B. Comparison of Rate-All-That-Apply (RATA) and Descriptive sensory Analysis (DA) of model double emulsions with subtle perceptual differences. Food Qual Prefer. 2017;56:55-68. doi:10.1016/j.foodqual.2016.09.010
- Vidal L, Ares G, Hedderley DI, Meyners M, Jaeger SR. Comparison of rate-all-that-apply ( RATA ) and check-all-that-apply ( CATA ) questions across seven consumer studies. Food Qual Prefer. 2018;67:49-58. doi:10.1016/j.foodqual.2016.12.013
- Ares G, Bruzzone F, Vidal L, et al. Evaluation of a rating-based variant of check-all-that-apply questions : Food Qual Prefer. 2014;36:87-95. doi:10.1016/j.foodqual.2014.03.006
- Hein KA, Jaeger SR, Carr BT, Delahunty CM. Comparison of five common acceptance and preference methods. Food Qual Prefer. 2008;19:651-661. doi:10.1016/j.foodqual.2008.06.001
- de Andrade JC, Nalério SE, Giongo C, de Barcellos DM, Ares G, Deliza R. Consumer sensory and hedonic perception of sheep meat coppa under blind and informed conditions. Meat Sci. 2018;137:201-210. doi:10.1016/j.meatsci.2017.11.026
- Kemsawasd V, Chaikham P. Effects of Frozen Storage on Viability of Probiotics and Antioxidant Capacities of Synbiotic Riceberry and Sesame – Riceberry Milk Ice Creams. Curr Res Nutr Food Sci. 2019;8(1).
- Wiruch P, Naruenartwongsakul S, Chalermchart Y. Textural Properties, Resistant Starch, and in Vitro Starch Digestibility as Affected by Parboiling of Brown Glutinous Rice in A Retort Pouch. Curr Res Nutr Food Sci. 2019;07(2). doi:10.12944/CRNFSJ.7.2.24
- Effendi S, Tukiran. Metode Penelitian Survei. Jakarta: LP3ES; 2012.
- Meilgaard MC, Civille GV, Carr BT. Sensory Evaluation Techniques. Fourth edi. New York: Taylor & Francis; 2007.
- Nugraheni D. Penanganan umbi bawang merah sebagai bahan baku bawang merah goreng. 2004.
- Kizito K, Abdel-Aal M, Ragab M, Youssef M. Quality attributes of French fries as affected by different coatings, frozen storage and frying conditions. J Agric Sci Bot. 2017;1(1):18-24. doi:10.35841/2591-7897.1.1.18-24
- Lund MN, Ray CA. Control of Maillard Reactions in Foods: Strategies and Chemical Mechanisms. J Agric Food Chem. 2017;65:4537-4552. doi:10.1021/acs.jafc.7b00882
- MacDougall D. Sensory Evaluation/Appereance. In: Encyclopedia of Food Science and Nutrition. Second Edi. Cambridge: Academic Press; 2003:5161-5167. doi:10.1016/B0-12-227055-X/01066-X
- Kitpot T, Sriwattana S, Angeli S, Thakeow P. Evaluation of Quality Parameters and Shelf Life of Thai Pork Scratching “Kaeb Moo.” J Food Qual. 2019;2019. doi:10.1155/2019/2421708

This work is licensed under a Creative Commons Attribution 4.0 International License.


