
Introducton
Rice (Oryza sativa L.) is a dietary staple for more than half of the global population, with traditional rice grain foods commonly derived from polished grains. Whole rice grain is suggested as part of healthy diets. It is becoming more and more popular in developed countries, because of its beneficial source of nutrition and high antioxidant activity that play positive roles in many chronic diseases. However, the hard texture and low cooking properties of brown rice inhibit the expansion of the market. Germinated rice, which produced by soaking and sprouting in warm water for some time, had potential prospects because of its softer texture and higher amounts of functional components. A wealth of research indicates that pigmented rice varieties, particularly red and black rice, possess a higher nutritional content and antioxidant capacity compared to their white counterparts.1 While whole rice is often considered tougher to chew and less palatable based on conventional sensory evaluation,2 pre-germinated rice has gained popularity due to its enhanced functional components and improved taste profile. Numerous epidemiological studies have linked the consumption of pre-germinated rice with a reduced risk of various chronic conditions, including Alzheimer’s disease, diabetes, hypercholesterolemia, certain types of cancer, cardiovascular diseases, and obesity.2,3
It is important to note that the consumption of brown rice has been associated with several health benefits, including the regulation of blood sugar levels and cholesterol, which are linked to the presence of various functional substances such as phenolic compounds and dietary fiber. However, the full spectrum of biological phenomena related to the production of these substances during the germination process is not yet fully understood. This study aims to explore the changes in phenolic profiles and antioxidant activity during the germination of brown rice, which could provide insights into the biological mechanisms underlying the health benefits of brown rice consumption. The germination process of rice grains is typically divided into two stages: soaking and sprouting.4 The soaking phase allows the grains to absorb sufficient water, which is essential for initiating sprouting. Sprouting not only enhances the content of certain functional components but also improves the rice’s palatability due to the breakdown of high molecular weight substances. However, the presence of microorganisms during the soaking and sprouting phases can lead to the degradation of rice grains, particularly whole brown rice, resulting in the production of off-flavors that may diminish consumer acceptance of germinated rice. Moreover, germinated brown rice is prone to losing many water-soluble nutraceuticals. In contrast, germinated rough rice can effectively retain its functional nutrients and exhibit resistance to microbial spoilage.5
The linkage between brown rice consumption and the biological phenomena related to the production of various functional substances is not well established in the current literature. This study addresses this gap by examining how the germination process affects the levels of phenolic acids, anthocyanins, and proanthocyanidins in brown rice. We hypothesize that germination will enhance the production of these functional substances, thereby increasing the health benefits associated with brown rice consumption.
Phenolic acids, as key secondary metabolites, are predominantly found in the bran and embryo of rice grains, constituting 59.2% of the total phenolic acids.6 They serve as a significant source of antioxidant activity. Both free and bound phenolic acids contribute to the overall health benefits of rice, with bound phenolic acids being particularly prevalent.7 To date, several studies have focused on the total phenolic content and antioxidant properties of free phenolics in rough or brown rice,8,9 as well as the dynamic changes in free and bound phenolic compounds during various stages of brown rice germination.10 In this study, we examined the variations in total phenolic and flavonoid content, antioxidant activity, total proanthocyanidins, anthocyanin content, and both free and bound phenolic compounds in pigmented (red and black) rough and brown rice. Additionally, principal component analysis was conducted to explore the first two principal components of variance. This research aims to significantly contribute to the enhancement of functional components and processes within the food industry. By focusing on the germination process, this study seeks to clarify the mechanisms by which brown rice can contribute to health promotion and disease prevention. The findings will be instrumental in guiding future research and developing strategies to maximize the nutritional and health benefits of brown rice through controlled germination processes.
Materials and Methods
Rice Samples and Chemistry Reagents
Red (Oryza sativa L. var. LF 19) and black (Oryza sativa L. var. anhuiheixian01) rice grains, harvested in 2022, were obtained from China National Rice Research Institute (CNRRI) and Anhui Academy of Agricultural Science, respectively. Rough rice was de-husked on a Satake rice de-husker (Satake Co., Tokyo, Japan). The broken kernels were removed manually to get the whole brown rice. Rough rice and brown rice were stored at 4 ℃ in dark before being used.
Chemistry reagents, such as Folin-Ciocalteu reagent, DPPH (2,2-diphenyl-1- picrylhydrazyl), trolox (6-hydroxyl-2,5,7,8-tetramethylchroman-2- carboxylic acid), ABTS·+ (2,2ʹ-Azino-bis-(3-ethylbenzonthiazoline-6-sulfonic acid) diammonium salt) and gallic acid were purchased from Sigma-Aldrich Chemical Co. (St. Louis, MO, USA). The HPLC grade methanol, ethyl acetate, and acetic acid used in the extraction, purification and HPLC analysis, were purchased from Merck (Darmstadt, Germany) and Tedia (Fairfield, USA), respectively. The phenolic acid standards (p-hydroxybenzoic (p-HA), p-coumaric (p-CA), protocatechuic (PA), vanillic (VA), sinapic (SA), ferulic (FA), and isoferulic acid (IFA)) were purchased form Sigma-Aldrich Chemical Co. (St. Louis, MO, USA). Sodium hydroxide, sodium sulfate, and hydrochloric acid were purchased from sinopharm chemical reagent Co., Ltd (Shanghai, China).
Preparation of Germinated Rough Rice and Brown Rice
To ensure the safety and effectiveness of the germination process, we followed a meticulous procedure for preparing germinated rough and brown rice. Initially, 25 grams of either rough or brown rice were submerged in 100 mL of a 0.05% sodium hypochlorite solution for 30 minutes. This step is crucial for sterilization to prevent microbial contamination that could compromise consumer safety. Following sterilization, the rice grains were transferred into petri dishes with a 150 mm diameter. Each dish was filled with 100 mL of distilled water to facilitate uniform germination. The dishes were then placed in a temperature-controlled chamber set at 30°C. The germination duration was varied, with samples being harvested at 12, 24, 36, and 48 hours post-soaking to assess the impact of germination time on phenolic profiles and antioxidant activity. To maintain optimal germination conditions, the distilled water was refreshed every 12 hours, ensuring a consistent moisture level and preventing stale water from affecting the germination process. After germination, the germinated rice grains were carefully collected and dried at 40°C for 24 hours to remove excess moisture and stabilize the nutritional profile). As shown in Figure 1S, the germination growth of red and black brown rice is significantly better than that of red and black rough rice. The dried germinated rough rice underwent de-hulling using a mill (Foss, Switzerland) to remove the husk, a step essential for comparing the nutritional profiles of husked and unhusked rice. The de-hulled rice was then ground into a fine powder and passed through a 100 mesh sieve to obtain a uniform germinated rough rice (GRR) powder. Similarly, the germinated brown rice grains were ground and sieved to achieve a consistent particle size, enhancing the accuracy of subsequent analyses. The ground brown rice was also sieved through a 100 mesh sieve to produce germinated brown rice (GBR) powder. All prepared samples were stored at -4°C to preserve their quality and prevent degradation prior to analysis. This rigorous preparation method ensures the reliability of our findings and their applicability to real-world conditions.
Extraction
Rice flour (0.5 g) was defatted twice with 10 mL of hexane. The total polyphenols was extracted with 10 mL of 80% ethanol twice. After shaking for 45 min (HY-8 Speed control shaker, China), the mixture was centrifuged at 10, 000 ×g for 15 min by using a high-speed centrifuge (Himac CR21GⅡ, Hitachi, Japan). The supernatants of each extraction were collected and combined together. The extracts were stored at –20 ℃ for analysis of total phenolic, flavonoid content and antioxidant activity. Duplicate extractions were carried out for each sample.
Determination of Total Phenolic Content (TPC)
TPC was assayed by Folin-Ciocalteu method with minor modifications.10,11 Briefly, 200 µL of appropriate diluted crude extracts or standard solutions were mixed with 1.5 mL of 10-fold diluted Folin-Ciocalteu reagent, and then neutralization with 1.5 mL saturated sodium carbonate (75 g/L). The absorbance was measured at 725 nm by a spectrophotometer (Unico Co, USA) after 2 h of reaction at room temperature in dark. Gallic acid solution (25, 50, 75, 100, 125 mg/L) was used as standard to generate the straight line equation (y = 149.78x – 1.9323, R² = 0.9995). The results of TPC were expressed as milligrams of gallic acid equivalent (GAE) per 100 g of samples (mg GAE/100 g). Duplicate determinations were carried out for each extract.
Determination of Total Flavonoid Content (TFC)
TFC was tested by using a colorimetric method with slight revisions.10,12 Beliefly, 150 µL of 5% NaNO2 was mixed with 500 µL of the sample extracts or standard solutions in 15 mL polypropylene tubes and then incubated for 15 min. After adding 150 µL of 10% AlCl3·6H2O and allowing 5 min of reaction, 1 mL NaOH (1 M) and 3 mL ddH2O were added. The absorbance was measured at 510 nm after thoroughly mixing and reacted for about 10 min. TFC was expressed as milligrams of catechin equivalent per 100 g of samples (mg CE/100 g). Duplicate determinations were carried out for each extract.
Determination of DPPH Radical Scavenging Activity (DPPH)
The DPPH radical scavenging activity of extracts was determined according to the method reported by Brand-Williams et al,13 and improved by Shao et al.1 An accurately measured 200 µL of the appropriately diluted crude extracts or standards was combined with 3 mL of a 100 µmol/L DPPH solution for the assay. After incubating for 30 min in dark, the absorbance was measured at the wavelength of 517 nm. The DPPH radical scavenging activity (%) was calculated by using the formula as follows:
DPPH (%) = ( 1 – Asample/Acontrol ) ×100
The straight line equation was generated from trolox standard and the results were expressed as µmol of trolox equivalent DPPH radical scavenging activity per 100 g of samples (µM TE/100 g). Duplicate determinations were carried out for each extract.
Determination of ABTS·+ Radical Scavenging Activity (ABTS)
The ABTS radical scavenging activity was measured by using a spectrophotometer according to the method previous reported.10,14 Briefly, ABTS·+ was produced by mixing 7 mM ABTS stock solution and 2.45mM potassium peroxydisulfate (V/V = 2:1) in dark at room temperature overnight. The ABTS·+ working solution was diluted by ethanol to adjust the absorbance to 0.700±0.020 at 734 nm. Appropriated diluted crude extracts or standards (100 µL) were mixed with 3.9 mL ABTS·+ working solution, reacted for about 6 min, and measured the absorbance at 734 nm. The results were expressed as µmol of trolox equivalent activity per 100 g of samples (µM TE/100 g). Duplicate determinations were carried out for each extract.
Determination of Total Proanthocyanidin Content (TPAC)
Rice flour (0.5 g) was extracted three times with 15 mL methanol: 1M HCl (85:15, V/V) by a shaker under dark conditions. After centrifuging at 4, 100 ×g for 15 min at room temperature, the clear supernatants were collected, combined together, and stored at -20 ℃ before tests of total proanthocyanidin, and anthocyanin content. TPAC was measured by using the method of vanillin assay with slight modifications.15 Briefly, appropriately diluted crude extracts or standard solutions (0.6 mL) were added to 1.5 mL of solution A (1% vanillin solution in methanol), and mixed thoroughly. Before reacting for 20 min in a 30 ℃ water bath, 1.5 mL of solution B (sulfuric acid/methanol solution (1:4, V/V)) was added. The absorbance was measured at 500 nm. Each extracts treated with 100% methanol instead of solution A was used as blank in order to eliminate interferences (e.g., anthocyanin, which mainly exists in black rice). TPAC was expresses as mg catechin equivalent per 100 g of samples (mg CE/100 g). Duplicate determinations were carried out for each extract.
Determination of Total Anthocyanin Content (TAC)
TAC was analyzed with pH differential method.16,17 Before determination of TAC, two buffer solutions were prepared, one buffer at pH 1.0 (1.49% KCl water buffer, acidified with HCl) and the other at pH 4.5 (1.64% sodium acetate water buffer, acidified with HCl). Each sample extract was diluted 10 times to a final volume of 2 mL with two buffer solutions, respectively. The absorbance of each sample was measured both at 520 nm and 700 nm. The TAC was expressed as cyanidin 3-glucoside equivalent, and calculated as follows:
Monomeric anthocyanin pigment (mg/L) = A × MW × DF × 1000/(ε × L)
Where A is the absorbance calculated as: A= (A520nm– A700nm)pH1.0 – (A520nm– A700nm)pH4.5; MW is the molecular weight for cyanidin 3-glucoside (449.5 g/mol); DF is the dilute factor and ε is the molar absorbance of cyanidin 3-glucoside 26,900 L/(cm× mol)); L is cell path length (1 cm), and 1000 is the conversion factor from milliliter to liter.
HPLC Analysis of Phenolic Acid Composition
The crude phenolic acids were extracted according to the method reported by Shao et al with little variations.1 Briefly, 1g of rice flour was mixed with 1mL of 95% ethanol in the 30 mL centrifuge tube. The mixture was digested with 4 M NaOH (30 mL) for 2 h in a shaker at room temperature. After adjusting pH to 1.5-2.0 with concentrated HCl, the extraction was centrifuged at 10, 000 ×g for 30 min. The supernatant was extracted with ethyl acetate (60 mL) twice. The ethyl acetate extraction were collected and combined together, and then dried at 37 ℃ by using a rotary evaporation (IKA RV10 control V, German). The dried extracts were dissolved in 50% methanol (5 mL) and stored at -20℃ before analysis.
The phenolic acid content was analyzed on a waters HPLC system (Waters Associates, Milford, Mass, USA) that consisted of a Waters 2707 autosampler, a Waters 2489 UV/Visible detector and a Waters 1525 binary pump. An XBridge 5 µm C18 column (250 mm × 4.6 mm) was used to separate the phenolic acids. Gradient elution was performed with a mobile phase consisted of A (0.1% acetic acid in water) and B (0.1% acetic acid in methanol). The flow rate was 1 mL/min, and the liner gradient was set according to the method reported by Shao (2014) as follows: 0-11 min, 9-14% B, 11-14 min, 14-15% B, 14-17 min, 15% B, 17-24 min, 15-16.5 % B, 24-28 min, 16.5-19% B, 28-30 min, 19-25% B, 30-36 min, 25-26% B, 36-38 min, 26-28% B, 38-41 min, 28-35% B, 41-46 min, 35-40% B, 46-48 min, 40-48% B, 48-53 min, 48-53% B, 53-70 min, 53-70% B, 70-72 min, 9% B, 72-75 min, 9% B.1 The injection volume was 10 µL, and the crude extracts were filtered through a 0.45 µm membrane filter before analysis. The column temperature was kept at 40 ℃. The phenolic acids were detected at a wavelength of 280 nm, and quantified by using the external calibration curves according to the retention time of phenolic acid standards.
Statistical Analysis
All the parameters were measured at least in duplicate, and presented on a dry weight basis as means ± standard deviation (SD). Data analysis was performed with SAS program version 8 (SAS Institute Inc., Cary, NC, U.S.A). Differences among germination stages were found by using ANOVA, and followed by Duncan multiple comparison tests. Statistical significance was defined at the level of P < 0.05. The correlation analysis among TPC, DPPH, ABTS, TFC, TPAC and TAC was carried out with pro corr. The principle component analysis was conducted by R 2.1.11.1 version.
Results
Total Phenolic Content (TPC) and Total Flavonoid Content (TFC) Analysis
It was shown in Fig.1 that black germinated rough rice (GRR) had the highest total phenolic content (TPC) and total flavonoid content (TFC) among all germinated rice types, while red germinated brown rice (GBR) had the lowest. In red rice, TPC and TFC in GRR dropped significantly within the first 12 hours of germination and then stabilized. For GBR, these values decreased gradually. In black rice, TPC in GRR decreased, then increased slightly, and finally stabilized, while in GBR, it decreased gradually and then leveled off. TFC in black GRR remained similar throughout germination, but in black GBR, it decreased and then stabilized.
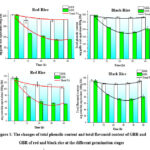 |
Figure 1: The changes of total phenolic content and total flavonoid content of GRR and GBR of red and black rice at the different germination stages |
Antioxidant Activitly Analysis
The antioxidant activity was assayed by DPPH and ABTS·+ radical scavenging capacity. As seen in Fig. 2. DPPH of GRR decreased significantly from 574.40 (0 h) to 510.98 µM TE/100 g (12 h), and then significantly increased to 531.98 (24 h), and finally kept at similar levels. ABTS of GRR decreased gradually from 450.57 (0 h) to 366.15 µM TE/100 g (24 h), and then increased to 390.10 µM TE/100 g at 36 h. DPPH and ABTS of GBR decreased gradually from 574.40 (0 h) to 241.10 (36 h), and from 450.57 (0 h) to 159.41 µM TE/100 g (36 h), respectively. In generally, DPPH and ABTS of GRR decreased by 11.0% and 18.7%, respectively. However, the loss of DPPH and ABTS in GBR was much higher, which decreased by 60.0% and 64.6%, respectively.
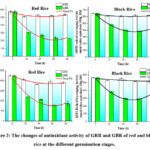 |
Figure 2: The changes of antioxidant activity of GRR and GBR of red and black |
For black rice, DPPH of GRR decreased significantly from 651.72 (0 h) to 612.64 µM TE/100 g (12 h), and then remained at similar levels from 12 to 48 h. ABTS of GRR decreased significantly from 567.07 (0 h) to 529.99 (12 h), and then from 558.62 (24 h) to 520.58 µM TE/100 g (36 h). DPPH and ABTS of GBR decreased gradually from 651.72 (0 h) to 406.22 (24 h), and from 567.07 (0 h) to 299.87 µM TE/100 g (24 h), respectively, and both of them rose again to 423.87 and 354.06 µM TE/100 g, respectively, at 48 h. In generally, DPPH and ABTS of GRR decreased by 6.1% and 8.2%, respectively, which were much lower than those of GBR with the values of 40.2% and 48.2%, respectively.
Total Proanthocyanidin Content (TPAC) and Total Anthocyanin Content (TAC)
TPAC and TAC of germinated rough and brown rice are shown in Fig. 3 and Fig. 4, where TPAC were only detected in red rice and TAC were only detected in black rice. TPAC of GRR and GBR had different degrees of reduction with the former reduced less than the latter. TPAC of GRR decreased significantly from 0 (402.93 mg CE/100 g) to 12 h (358.94 mg CE/100 g), and continued at similar content from 12 to 48 h. TPAC of GBR decreased significantly from 402.93 (0 h) to 221.39 mg CE/100 g (12 h), and then dropped to 152.74 mg CE/100 g at 36 h, and kept almost the same from 36 to 48 h. In generally, TPAC of GRR and GBR decreased by 17.6% and 62.8%, respectively. TAC of GRR and GBR reduced gradually from 133.98 (12 h) to 101.32 mg C3G equivalent/ 100 g (36 h), and from 126.11 (0 h) to 47.29 mg C3G equivalent/ 100 g (24 h), respectively. In generally, TAC of GRR and GBR decreased by 23.5% and 70.5%, respectively.
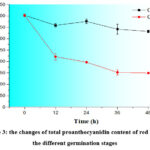 |
Figure 3: the changes of total proanthocyanidin content of red rice at the different germination stages |
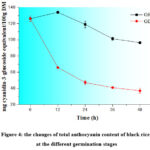 |
Figure 4: the changes of total anthocyanin content of black rice at the different germination stages |
Analysis of Phenolic Acids Composition
The high-performance liquid chromatography (HPLC) analysis was employed to quantify the phenolic acids in germinated rice grains, as shown in Fig. 5. A total of seven phenolic acids were identified, including p-hydroxybenzoic (p-HA), p-coumaric (p-CA), protocatechuic (PA), vanillic (VA), sinapic (SA), ferulic (FA), and isoferulic acid (IFA). Notably, VA was exclusively detected in germinated black rice, while p-HA was found in trace amounts in germinated red rice. The chromatograms of seven phenolic acids are consistent with the research of Shao et al.1
 |
Figure 5: Changes of phenolic acids in GRR and GBR of red and black rice during different germination stages. |
In red rice, six phenolic acids were identified, with FA being the most abundant. In germinated rough rice (GRR), FA levels significantly increased, peaking at 160.56 mg/100 g after 36 hours of germination. In contrast, in germinated brown rice (GBR), FA levels rose to 129.03 mg/100 g at 24 hours and remained stable thereafter. p-CA in GRR increased to a peak of 41.92 mg/100 g at 36 hours, whereas in GBR, it was highest at 24-48 hours. PA in GRR rose gradually, but in GBR, it remained constant from 12 to 48 hours. SA levels in both GRR and GBR were significantly higher at 24-48 hours compared to the initial stage. IFA content decreased initially in both types of rice and then stabilized. Overall, the levels of p-CA, SA, and FA increased by 103.8%, 75.3%, and 93.8% in GRR, and by 61.6%, 54.0%, and 55.8% in GBR, respectively. IFA showed a decreasing trend, dropping by 44.4% in GRR and 50.3% in GBR.
In black rice, seven phenolic acids were found in both black germinated rough rice (GRR) and black germinated brown rice (GBR), with FA being the most abundant, followed by PA. Initially, both GRR and GBR had higher FA levels, which then stabilized from 12 to 48 hours. In GRR, PA peaked at 48 hours with 249.64 mg/100 g, while in GBR, it bottomed out at 48 hours with 125.15 mg/100 g. p-HA in GRR remained similar from 12 to 48 hours, but in GBR, it was significantly lower at 24-48 hours compared to the initial stage. Phenolic acids like p-CA, VA, SA, and IFA showed little change in both GRR and GBR, with slightly higher levels at 0 or 48 hours. Germination in GRR led to a decrease in p-HA, p-CA, VA, SA, FA, and IFA by 38.2%, 25.5%, 23.4%, 27.1%, 23.0% and 38.9%, respectively. In GBR, germination caused a decrease in p-HA, p-CA, PA, VA, SA, and FA by 30.1%, 21.9%, 45.1%, 40.5%, 26.0% and 20.7%, respectively.
Correlation and Principle Component Analysis
The pairwise correlation analysis among TPC, TFC, DPPH, ABTS, and TPAC (or TAC) during germination process is shown in Table 1. TPC, TFC, and TPAC (or TAC) were positive significant correlated with antioxidant activity (P<0.001), which was similar as previous studies.7,10 Although the correlation coefficient between TFC and TAC was the lowest, it was still at the most significant level. Therefore, it is possible for food industry to test only one parameter to evaluate the antioxidant activity of germinated rice grain during germination.
Table 1: Correlation analysis of TPC, TFC, DPPH, ABTS, TPAC (TAC) in germinated red and black rice a
|
|
TPC | TFC | DPPH | ABTS | TPAC (TAC) |
|
TPC |
– | 0.975*** | 0.991*** | 0.983*** | 0.991*** |
| TFC | 0.99*** | – | 0.970*** | 0.966*** |
0.981*** |
|
DPPH |
0.992*** | 0.987*** | – | 0.978*** | 0.982*** |
| ABTS | 0.989*** | 0.974*** | 0.985*** | – |
0.980*** |
| TPAC (TAC) | 0.924*** | 0.914*** | 0.945*** | 0.945*** |
– |
a *** indicate significant difference at 0.001; above diagonal : germination red rice which had detectable TPAC; below diagonal: germination black rice which had detectable TAC
The effects of germination on TPC, DPPH, ABTS, TFC, TPAC and TAC of red and black rice were clearly seen through principal component analysis (PCA) of the genotypes and germinated forms (Fig. 6). The first two of principal components could explain 92.18% of total variance, and it could be divided into 4 groups as red GRR, red GBR, black GRR, and black GBR. All the four groups were in 95% confidential levels. Black GRR and GBR were in the positive positions of PC1, and red and black GRR were in positive positions of PC2. It could be concluded that germinated black rice had higher TPC, DPPH, ABTS and TFC than red rice, and germinated rough rice had higher TPC, DPPH, ABTS and TFC than germinated brown rice.
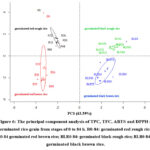 |
Figure 6: The principal component analysis of TPC, TFC, ABTS and DPPH of germinated rice grain from stages of 0 to 84 h. R0-84: germinated red rough rice; B0-84 germinated red brown rice; BLR0-84: germinated black rough rice; BLB0-84: germinated black brown rice. |
Discussion
The present study investigated the changes in phenolic profiles and antioxidant activity in pigmented (red and black) rough and brown rice during the germination process. Our findings revealed significant alterations in total phenolic content (TPC), total flavonoid content (TFC), antioxidant activity, total proanthocyanidin content (TPAC), and total anthocyanin content (TAC) during germination. These results provide insights into the effects of germination on the nutritional and functional properties of rice.
Our results showed that TPC and TFC in both red and black rice decreased during the germination process. Notably, germinated rough rice (GRR) had higher TPC and TFC compared to germinated brown rice (GBR), which may be attributed to the protective effect of the rice hulls. This suggests that rough rice might be a better choice for germination as its outer layers can preserve more phenolic compounds. However, previous studies have reported an increase in TPC during germination, which is different from our findings.8,18 This discrepancy might be due to the different germination methods used. For instance, previous studies employed a more complex process involving sodium hypochlorite treatment, neutralization, and soaking in distilled water, whereas we simplified this to just sterilization and soaking.18 The frequent changing of distilled water in previous studies likely led to the loss of water-soluble compounds, causing the decrease in TPC and TFC observed in our study.
The antioxidant activity, measured by DPPH and ABTS radical scavenging capacity, exhibited a similar trend to TPC. Black GRR had the highest antioxidant activity, followed by red GRR, black GBR, and red GBR. The high correlation coefficient among antioxidant activity and TPC indicates that phenolic compounds play a significant role in the antioxidant capacity of rice.19 The decrease in antioxidant activity during germination can be attributed to the reduction in TPC and TFC, as these compounds are major contributors to antioxidant activity.
Proanthocyanidins and anthocyanins, as secondary metabolites, are mainly found in red and black rice, respectively. These compounds have been reported to inhibit the mobility and invasion of some human cancers and have positive effects on cardiovascular disease, type Ⅱ diabetes, and obesity.21,22 Our study found that TPAC and TAC decreased during the germination process, which is consistent with previous studies.23 Germinated red and black rough rice had significantly higher TPAC and TAC compared to germinated brown rice, respectively. This suggests that the outer layers of rough rice may protect these compounds from degradation during germination. Future studies should focus on preventing the loss of proanthocyanidins and anthocyanins during the germination process to maximize the health benefits of pigmented rice.
The HPLC analysis revealed significant changes in phenolic acids during germination. In red rice, the levels of p-coumaric acid (p-CA), sinapic acid (SA), and ferulic acid (FA) increased during germination, particularly in GRR. Conversely, in black rice, the levels of these phenolic acids decreased during germination. This difference can be attributed to the different genotypes and characteristic compounds of red and black rice. For instance, the black color in rice is controlled by two loci (Pb and Pp), while the red color is controlled by two complementary genes (Rc and Rd).24 Black rice sprouted faster than red rice, leading to the catabolism of phenolic acids from the bound form to the free form, which could be easily discarded during soaking germination.25
The correlation analysis showed a strong positive correlation between TPC, TFC, antioxidant activity (DPPH and ABTS), TPAC, and TAC. This indicates that these parameters are closely related and can be used to evaluate the nutritional and functional properties of germinated rice. The principal component analysis (PCA) grouped the germinated rice into distinct categories based on these parameters, further validating the changes observed during germination. The first two principal components explained 92.18% of the total variance, highlighting the significant impact of germination on the phenolic profiles and antioxidant activity of rice.
In conclusion, our study suggests that germinated rough rice (GRR) holds more health benefits compared to germinated brown rice (GBR), with black rice proving to be more nutritious than red rice. These findings provide valuable insights for the food industry in developing functional grain products enriched with health-promoting phytochemicals. Future research should focus on understanding the specific mechanisms by which germination enhances the bioavailability of these compounds and exploring additional methods to preserve or enhance their levels in germinated rice products.
Conclusion
This study provides a detailed examination of the changes in phenolic profiles and antioxidant activity in both red and black pigmented rough and brown rice during the germination process. Our results indicate that while germination leads to a gradual reduction in total phenolic and flavonoid content, as well as antioxidant activity. Notably, germinated rough rice demonstrated significantly higher levels of key phytochemicals compared to germinated brown rice, suggesting its potential as a more nutritious option in germination-based applications. The findings of this study contribute valuable insights into the effects of germination on the nutritional and functional properties of rice. The results underscore the importance of considering the germination process in future research endeavors aimed at maximizing the health benefits of rice consumption. Furthermore, our findings offer practical implications for the food industry in developing functional grain products enriched with health-promoting phytochemicals. A strong correlation was observed between total phenolic content (TPC), total flavonoid content (TFC), DPPH, ABTS, total proanthocyanidin content (TPAC), and total anthocyanin content (TAC) during germination. Principal component analysis (PCA) effectively grouped the germinated rice into distinct categories based on these parameters, further validating the changes observed.
In conclusion, our study suggests that germinated rough rice (GRR) holds more health benefits over germinated brown rice (GBR), with black rice proving to be more nutritious than red rice. These findings can guide the food industry in creating healthier grain products. Further research should focus on understanding the specific mechanisms by which germination enhances the bioavailability of these compounds and exploring additional methods to preserve or enhance their levels in germinated rice products.
Acknowledgement
We would like to express sincere gratitude to the China National Rice Research Institute (CNRRI) for their support in the research work. Special thanks are also extended to the School of Food and Pharmacy, Shanghai Zhongqiao Vocational and Technical University, for providing the necessary facilities and resources for this study.
Funding Source Section
This study was supported by the Natural Science project of Shanghai Zhongqiao Vocational and Technical University (ZQZR202439).
Conflict of Interest
The authors do not have any conflict of interest.
Data Availability Statement
Data will be made available on request.
Ethics Approval Statement
This study did not involve human participants, animal subjects, and any material that requires ethical approval.
Informed Consent Statement
This study did not involve human participants, and therefore, informed consent was not required.
Cinical Trial Registration
This study did not involve clinical trial, and therefore, it is not registered in any Registry of Clinical Trials.
Author Contributions
The sole author was responsible for the conceptualization, methodology, data collection, analysis, writing, and final approval of the manuscript.
Permission to reproduce material from sources
Not Applicable
References
- Shao Y. F, Xu F, Sun X, Bao J. S, Beta T. Identification and quantification of phenolic acids and anthocyanins as antioxidants in bran, embryo and endosperm of white, red and black rice kernels (Oryza sativa L.). J. Cereal Sci. 2014; 59:211-218. doi: 10.1016/j.jcs. 2014.01.004.
CrossRef - Patil S. B, Khan M. K. Germinated brown rice as value added rice product: A review. J Food Sci.Tech Mys. 2011; 48:661-667. doi: 10.1007/s13197-011-0232-4.
CrossRef - Wu F, Yang N, Touré A, Jin Z, Xu X. Germinated brown rice and its role in human health. Crit Rev Food Sci. 2013; 53:451-463. doi: 10.1080/10408398.2010.542259.
CrossRef - Chinma E, Anuonye J. C, Simon O. C, Ohiare R. O, Danbaba N. Effect of germination on the physicochemical and antioxidant and characteristics of rice flour from three rice varieties from Nigeria. Food Chem. 2015; 185:454-458. doi:10.1016/j.foodchem.2015. 04.010.
CrossRef - Moongngarm A, Saetung N. Comparison of chemical compositions and bioactive compounds of germinated rough rice and brown rice. Food Chem. 2010; 122:782-788. doi: 1016/j.foodchem.2010.03.053.
CrossRef - Ti H, Li Q, Zhang R, Zhang M, Deng Y, Wei Z, et al. Free and bound phenolic profiles and antioxidant activity of milled fractions of different indica rice varieties cultivated in southern China. Food Chem. 2014; 159: 166-174. doi: 1016/j.foodchem.2014.03. 029.
CrossRef - Shao Y. F, Xu F, Sun X, Bao J. S, Beta T. Analysis of genotype, environment, and their interaction effects on the phytochemicals and antioxidant capacities of red rice (Oryza sativa ). Cereal Chem. 2015; 92:204-210. doi: 10.1094/CCHEM-06-14-0126-R.
CrossRef - Ti H, Zhang R, Zhang M, Li Q, Wei Z, Zhang Y, et al. Dynamic changes in the free and bound phenolic compounds and antioxidant activity of brown rice at different germination stages. Food Chem. 2014; 161: 337-344. doi: 1016/j.foodchem.2014. 04.024.
CrossRef - Donkor O. N, Stojanovska L, Ginn P, Ashton J, Vasiljevic T. Germinated grains–Sources of bioactive compounds. Food Chem. 2012; 135:950-959. doi: 1016/j.foodchem. 2012.05.058.
CrossRef - Shen Y, Jin L, Xiao P, Lu Y, Bao J. S. Total phenolics, flavonoids, antioxidant capacity in rice grain and their relations to grain color, size and weight. J. Cereal Sci. 2009; 49:106-111. doi:1016/j.jcs.2008.07.010.
CrossRef - Singleton V. L, Orthofer R, Lamuela-Raventos R. M. Analysis of total phenols and other oxidation substrates and antioxidants by means of Folin-Ciocalteu, reagent. Method. Enzymol. 1999; 299:152-178. doi: 1016/S0076-6879(99) 99017-1.
CrossRef - Jia Z, Tang M, Wu J. The determination of flavonoid contents in mulberry and their scavenging effects on superoxide radicals. Food Chem. 1999; 64:555-559. doi: 1016/S0308-8146(98)00102-2.
CrossRef - Brand-Williams W, Cuvelier M. E, Berset C. Use of a free radical method to evaluate antioxidant activity. LWT. 1994; 28: 25-30. doi: 10.1016/S0023-6438 (95)80008-5.
CrossRef - Re R, Pellegrini N, Proteggente A, Pannala A, Yang M, Rice-Evans C. Antioxidant activity applying an improved ABTS radical cation decolorization assay. Free radical bio.med, 1999; 26(9-10):1231-1237. doi: 1016/S0891- 5849(98)00315-3.
CrossRef - Sun B, Ricardo-da-Silva J. M, Spranger I. Critical factors of vanillin assay for catechins and proanthocyanidins. J. Agric. Food Chem. 1998; 46:4267-4274. doi: 1021/jf 980366j.
CrossRef - Fuleki T, Francis F. J. Determination of total anthocyanin and degradation index of cranberry juice. Food Sci. 1968; 33:78-83. doi: 1111/j.1365-2621.1968.tb00888.x.
CrossRef - Hosseinian F. S, Li W. D, Beta T. Measurement of anthocyanins and other phytochemicals in purple wheat. Food Chem. 2008; 109:916-924. doi: 1016/j.foodchem.2007.12.083.
CrossRef - Frías J, Miranda-Zárate M. L, Vidal-Valverde C. Effect of germination and fermentation in the antioxidant vitamin content and antioxidant capacity of Lupinus albus L., var. Multolupa. Food Chem. 2005; 92: 211-doi: 10.1016/j.foodchem.2004.06.049.
CrossRef - Bao J. S, Cai Y. Z, Sun M, Wang G. Y, Corke H. Anthocyanins, flavonoids, and free radical scavenging activity of Chinese bayberry (Myrica rubra) extracts and their color properties and stability. Food Chem. 2005; 53:2327-2332. doi:10.1021/jf048312z.
CrossRef - Min B, McClung A. M, Chen M. H. Phytochemicals and antioxidant capacities in rice brans of different color. J. Food Sci. 2011; 76, C117- doi: 10.1111/j.1750-3841. 2010.01929.x.
CrossRef - Chen P. N, Kuo W. H, Chiang C. L, Chiou H. L, Hsieh Y. S, Chu S. C. Black rice anthocyanins inhibit cancer cells invasion via repressions of MMPs and u-PA expression. Chem-Biol Interact. 2006; 163: 218-229. doi: 1016/j.cbi.2006.08.003.
CrossRef - Dipti S. S, Bergman C, Indrasari S. D, Herath T, Hall R, Lee H, et al. The potential of rice to offer solutions for malnutrition and chronic diseases. Rice. 2012; 5:1-18. doi:1186/1939-8433-5-16.
CrossRef - Fan M, Yan Y, Waleed A, Qian H, Li Y, Rao Z , et al. Germination-induced changes in anthocyanins and proanthocyanidins: A pathway to boost bioactive compounds in red rice. Food Chem, 2024; 433, 137283. doi: 10.1016/j.foodchem.2023.137283.
CrossRef - Furukawa T, Maekawa M, Oki T, Suda I, Iida S, Shimada H, et al. The Rc and Rd genes are involved in proanthocyanidin synthesis in rice pericarp. The Plant J, 2007; 49(1):91-102. doi: 1111/j.1365-313X.2006.02958.x.
CrossRef - Gu X. Y, Foley M. E, Horvath D. P, Anderson J. V, Feng J, Zhang L, et al. Association between seed dormancy and pericarp color is controlled by a pleiotropic gene that regulates abscisic acid and flavonoid synthesis in weedy red rice. Genetics. 2011; 189:1515-1524. doi: 1534/genetics.111.131169.
CrossRef

This work is licensed under a Creative Commons Attribution 4.0 International License.


