
Introduction
Obesity represents a major health issue worldwide, affecting individuals across the lifespan and contributing to various chronic diseases.1 The prevalence of obesity among children and adolescents has been on the rise, with substantial implications for public health.2
Obesity is often associated with metabolic disorders that result from hypertrophy and hyperplasia of adipocytes, leading to inflammation of adipose tissue and ultimately causing adipocyte dysfunction.3 Excessive nutrient intake in obesity can trigger oxidative stress and mitochondrial dysfunction in adipocytes.4 This obesity-induced inflammation can lead to adipocyte dysfunction, such as dedifferentiation of adipocytes or suppression of glucose uptake.5 Hypertrophic adipocytes have altered metabolic and endocrine functions compared to smaller adipocytes, contributing to metabolic dysfunction.6 In obesity, inflamed adipocytes recruit immune cells like macrophages, leading to a chronic state of low-grade inflammation in adipose tissue and reactive oxygen species (ROS) generation.7 Adipocytes produce various pro-inflammatory cytokines and chemokines, such as TNF-α, IL-6, and MCP-1, contributing to adipose tissue inflammation.8 This interaction promotes the retention of macrophages in obese adipose tissue, driving further pro-inflammatory polarization and enhancing adipocyte dysfunction.9 Dysregulation of adipokines and chemokines in the crosstalk between adipocytes and macrophages exacerbates adipose tissue inflammation.10 Additionally, pro-inflammatory and adipocyte hypertrophy responses are closely associated with the development of insulin resistance in adipose tissue.11
Brown rice is a whole grain that is higher in fiber vitamins, minerals, and antioxidants compared to refined white rice.12,13 Gamma oryzanol, a ferulic acid ester found in the bran layer of brown rice, has been shown to possess anti-inflammatory and antioxidant effects.14 Studies have indicated that gamma oryzanol may ameliorate obesity-associated metabolic disorders, suggesting a role in mitigating inflammation and metabolic dysfunction in adipose tissue.15 Targeting adipose tissue macrophages (ATMs) and understanding their role in adipose tissue inflammation may offer potential therapeutic strategies for mitigating the adverse metabolic effects of obesity. This study designed to determine the impact of administering brown rice and gamma oryzanol on the size and quantity of adipocytes, as well as adipose tissue macrophages, in diet-induced obesity rats model.
Materials and Methods
Animal Experiment
This study was a true experimental in vivo test, post-test only control group with 42 male Sprague Dawley rats, 10-12 weeks old, weighing 200-250 grams, and in healthy condition. The rats were housed individually in a 12-hour light/dark cycle. After two weeks of acclimatization, seven rats were in the negative control group (NG) on a standard diet AIN-93M. The remaining 35 rats were given a high-fat, high-fructose (HFHFr) diet for 14 weeks to induce obesity. After developing obesity, the rats were divided into five groups: positive control (PG-HFHFr), T1 treatment (HFHFr + brown rice), T2 (HFHFr + white rice), T3 (HFHFr + white rice + ORZ), and T4 (HFHFr + ORZ). The treatment was administered for 12 weeks period. The gamma oryzanol used in this study was produced by Panca Prima Wijaya Co., Ltd, Jakarta, Indonesia.
The T1 group was given a mix of 337.5 grams of brown rice in 1 kilogram of HFHFr. which was determined based on statistical data regarding the average rice consumption of the Indonesian population. Meanwhile, the T2 group received a mixture of HFHFr and white rice that was the same weight as brown rice. We gave the T3 group a combination of dietary HFHFr, white rice, and 3.5 grams of ORZ based on the examination of the ORZ levels in brown rice using High-Performance Liquid Chromatography (HPLC). On the other hand, group T4 received a mixture of HFHFr diet and 3.5 grams of ORZ only. The duration of treatment lasted for 12 weeks. Weekly body weight (BW) measurements are taken, and food residues are collected daily. The study has received approval from the Health Research Ethics Commission of the Faculty of Medicine, Universitas Brawijaya. Malang, Indonesia.
Rats are categorized based on their anthropometric status using the subsequent formula: Body Mass Index (BMI) = (body weight in grams) / (body length in cm)2. A BMI exceeding 0.68 grams/cm2 is classified as obese. The adiposity index is a recognized method for quantifying body fat in rats. The calculation involves dividing the combined weight of fatty tissue in the mesenteric, epididymis, retroperitoneal, and perirenal areas by the individual’s body weight, and then multiplying the quotient by 100. This data is presented in the form of a percentage.16
Sample Collection and Preparation
After fasting for twelve hours, the rats were euthanized with ketamine and xylazine. Following the rats’ dissection, visceral adipose tissues (VAT) were collected from the mesenteric, epididymis, retro-peritoneal, and perirenal areas and subcutaneous adipose tissues (SAT) were collected from underneath the skin. Each sample then divided into two parts, one was fixated in 90% formaldehyde solution and embedded in paraffin, and the other was washed in Phosphate Buffer Saline solution (PBS) and stored in the freezer.
Histological Assessment of Adipose Tissue
Formalin-fixed, paraffin-embedded white adipose tissues were sectioned and de-paraffinized in a Biogear Poly-L-Lysine slide. Slides were stained by Hematoxylin Eosin (HE) and set for at least 24 h. Using an inverted microscope, five representative photos of each section are taken with a 40x objective. Slide images were then analyzed using ImageJ (Fiji-64 bit) with Adiposoft Plugins to measure the size and number of adipocyte cells. Immunohistochemistry staining was performed to examine the macrophage infiltration in adipose tissue, utilizing cell-specific anti-CD68 markers for targeted staining (KP1) (sc-20060 Santa Cruz Biotechnology, Inc).
Analysis of Macrophage Expression
The immunofluorescence staining method was used to analyse the expression of macrophages (M1 and M2). The slides were stained and incubated with antibodies, including Rat anti-F4/80 (NB600-404, Novus Biological, LLC), which is a macrophage marker; anti-CD11c (sc-398708, Santa Cruz Biotechnology, Inc), which is specific to M1 macrophages; and anti-CD206 (sc-58986, Santa Cruz Biotechnology, Inc) which is specific to M2 macrophages. Following the staining and incubation period, the slides must be covered and shielded from light before analysis. A total of five representative images of each slide were captured using a fluorescence microscope with a 40x objective and analysed using the ImageJ (Fiji 64-bit) software.
Statistical Analysis
The differences between variables were analyzed using the ANOVA test and Tukey post-hoc test. If the data are not normally distributed, the analysis process continues using the Kruskal-Wallis Test and Mann-Whitney U post-hoc test. All research data is processed computerized using Statistical Package for the Social Sciences (SPSS) software, IBM SPSS Statistics 20 with a significance level or p-value<0.05 and a confidence level of 95%. Data are presented in mean ± SEM.
Results
All rats in the treatment group developed obesity, as indicated by a BMI exceeding 0.68 g/cm2. As seen in Table 1, the lowest mean adiposity index of rats was in the NG group, while the highest mean was in the PG group. The NG group had the lowest average adiposity index among rats, while the PG group had the highest average. This was also observed in the weight of visceral and subcutaneous fat.
Adipose tissue expansion can be seen as hypertrophy (increased size) of adipocytes and hyperplasia (increased number of adipocytes). The NG group had the highest mean number of adipocyte cells. The T1 group receiving brown rice and the T3 group receiving ORZ had no difference in the number of adipocytes in visceral fat compared to the NG group (Table 2).
Table 1: Adiposity index and white adipose tissue weight.
|
NG |
PG | T1 | T2 | T3 | T4 |
P-value |
|
|
Adiposity index (%) |
4.04
± 1.08 |
6.88
± 2.24 |
5.38
± 2.72 |
4.6
± 2.47 |
3.94
± 1.52 |
5.08
± 1.59 |
0.099 |
| Visceral fat (g) | 3.47
± 1.8a |
10.21
± 3.7b |
5.39
± 2.98a,c |
4.91
± 4.21a,c |
3.7
± 2.35a,c |
4.63
± 2.07a,c |
0.000 |
|
Subcutaneous fat (g) |
3.22
± 0.72 |
6.82
± 2.7 |
4.85
± 2.75 |
3.74
± 2.35 |
3.79
± 1.71 |
4.38
± 1.47 |
0.522 |
All values were mean ± SEM (n= 7 rats/group).
Differences in mean adiposity index were analyzed using Two-Way ANOVA followed by the post-hoc Tukey HSD test. Differences in mean white adipose tissue weight between groups were analyzed using Two-Way ANOVA followed by the post-hoc Tukey HSD test. Values with different superscripts within a row were significantly different (p <0.05). The groups were indicated as NG (negative control group), PG (positive control group), T1 (HFHFr + brown rice), T2 (HFHFr + white rice), T3 (HFHFr + white rice + ORZ), and T4 (HFHFr + ORZ).
Adipocyte hypertrophy can be seen from the area and diameter of adipocytes as shown in Figure 1. The largest adipocyte diameter was observed in PG rats in both visceral and subcutaneous fat. The inclusion of brown rice and ORZ in treatment groups T1 and T3 appears to improve adipocyte expansion via decreasing cell size and diameter.
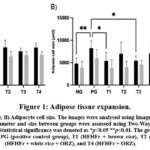 |
Figure 1: Adipose tissue expansion. |
Figure 2 demonstrates that the presence of macrophages CLS+ (crown-like structures) in visceral fat was notably greater in the PG and T4 groups. No differences in CLS macrophage density were found in subcutaneous fat between groups. Brown rice significantly inhibits the infiltration of macrophages in adipose tissue.
Table 2: Adipocyte cell number
|
Average number of adipocytes |
NG | PG | T1 | T2 | T3 | T4 | P-value |
| Visceral fat | 282.12 ±
48.67a |
145.93
± 27.08b,c |
232.37
± 76.29a,b |
167.24
± 68.28a,b,c |
241.83 ±
70.1a,b |
108.73 ±
67.1c |
0.00 |
|
Subcutaneous fat |
295 ±
43.19a |
180.04 ±
39.5a,b,c |
282.29 ±
79.35a |
223.88
± 54.35a,b |
145.08
± 78.63b,c |
112.32 ±
56.42c |
0.00 |
All values were mean ± SEM (n= 7 rats/group).
Differences in mean number of adipocyte cells between groups were assessed using Two-Way ANOVA, followed by the post-hoc Tukey HSD test. Values with different superscripts within a row were significantly different (p <0.05). The groups were indicated as PG (positive control group), NG (negative control group), T1 (HFHFr + brown rice), T2 (HFHFr + white rice), T3 (HFHFr + white rice + ORZ), and T4 (HFHFr + ORZ).
In both visceral and subcutaneous adipose tissue, the T1 group had the lowest level of M1 macrophage expression, while the NG group displayed the highest level of M2 macrophage expression. The M1/M2 ratio in the NG and T1 groups had a significantly lower value in comparison to the remaining groups. However, there were no notable disparities observed across all groups in terms of M1 and M2 macrophage expression or the M1/M2 ratio (Figure 3).
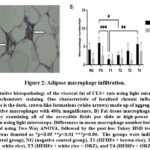 |
Figure 2: Adipose macrophage infiltration. |
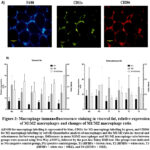 |
Figure 3: Macrophage immunofluorescence staining in visceral fat, relative expression of M1M2 macrophages and changes of M1/M2 macrophage ratio. |
Discussion
Brown rice is known to be rich in fiber essential minerals, and bioactive compounds. Brown rice’s minimal processing sets it apart from other rice varieties because it retains the outer layer, including the rice bran. Studies have shown that brown rice contains higher quantities of phytochemicals compared to white rice.17 Phenolics are the main bioactive compounds present in brown rice, along with flavonoids, γ-oryzanol (ORZ), various phytosterols, and γ-amino butyric acid (GABA). The total phenolic content is 9.3 times higher in darker brown rice than white rice.18,19
Based on its distribution, adipose tissue is divided into subcutaneous adipose tissue, which has the largest fat storage and is located under the skin, and visceral adipose tissue, which is located in the internal organs.20 Disorders in the level of precursor cell commitment and subcutaneous adipose tissue are associated with metabolic complications. Excessive storage capacity in subcutaneous adipose tissue results in the accumulation of fat in ectopic tissue like the liver, skeletal muscle, and heart as visceral adipose tissue. The accumulation of excess fat in ectopic tissue will lead to inflammation and insulin resistance. Fat tissue expansion can occur through hypertrophy or hyperplasia. In rats, visceral fat will expand through hypertrophy, while subcutaneous fat will expand through hyperplasia.21 Adipocyte hypertrophy, rather than overall obesity, is considered a major contributor to adipose tissue inflammation and insulin resistance.22
According to Figure 1, the largest adipocyte diameter and size were found in the PG group. The hypertrophy condition in the PG group might be caused by the continuous high-fat diet that resulted in excessive fat storage, dysregulation of adipocytes and lead to local and systemic inflammation.23 Meanwhile, the T1 and T3 treatment groups had significant differences compared to the PG group. The addition of brown rice and ORZ to a high-fat, high-fructose diet seems to lower the expansion of adipocytes by reducing both cell size and diameter.
Gamma-oryzanol, a specific component in brown rice, suppressed the expression of adipogenic transcription factors like enhancer-binding proteins (C/EBPs) and peroxisome proliferator-activated receptor gamma (PPAR-γ), which prevented the development of mature adipocytes.15 Other studies stated that gamma-oryzanol also has anti-adipogenic properties by inhibiting the mRNA expression of fatty acid synthase (FAS).24 The benefits of γ-oryzanol may be synergistically enhanced by other bioactive substances found in the brown rice, including phytic acid, kaempferol, vanillin, fisetin, ferulic acid, α-tocopherol, and γ-amino butyric acid.25,26
Macrophages are the largest cell type among leukocytes present in adipose tissue and are heterogeneous with functions and phenotypes influenced by the surrounding environment. The M1, or pro-inflammatory macrophage, produces pro-inflammatory cytokines such as interleukin-1β (IL-1β), IL-6, IL-12, IL-23, and TNF-α in response to both infection and stress. The M2, or anti-inflammatory and immuno-regulatory macrophages, produce IL-10 and TGF-β, which play a role in tissue repair, remodeling, vasculogenesis, and homeostasis.27 The M2 CD206+ macrophages appear to be dominant in the interstitial among adipocytes, whereas M1 CD11c+ macrophages are commonly found in adipocyte necrosis or crown-like structure (CLS).28
Based on previous research, increased adipocyte cell size is a factor that triggers macrophage infiltration. A positive correlation was obtained between the size of adipocyte cells and the density of the CLS macrophages.29 This is in line with the results in Figure 1 and Figure 2. The PG group has the largest diameter and size of adipocyte cells compared to other groups, as does the number of CLS macrophages. Excess fat and increased adipocyte cells size are associated with an increased frequency of adipocyte cell death and changes in the recruitment of ATM. Obesity-related adipocyte cell deaths occur through alternative pathways of necrosis and apoptosis, so-called paraptosis. Hypertrophic adipocyte cells suffer multiple cytotoxic stresses, including endoplasmic reticulum stress, increased TNF-α, species-reactive oxygen, and free fatty acids. The cytotoxic stress activates the signaling pathway of inflammation, thus inducing cell death and suppressing adipocyte insulin signaling and PPAR gene expression.30
As shown in Figure 3, the highest M1 macrophage expression and the M1/M2 ratio are found in the PG group, whereas the lowest M1 macrophage expressions as well as M1/M2 ratios are observed in the NG and T1 groups. This proves that adding brown rice to a high-fat, high-fructose diet is effective in reducing inflammation in rats with obesity conditions. Previous research suggested that high-calorie diets, high fructose or sugar, and high cholesterol can activate pro-inflammatory conditions with the dominance of M1 macrophages in adipose tissue, while dietary components such as fiber, n-3-polyunsaturated fatty acid (PUFA), and bioactive flavonoids can enhance the profile of M2 macrophages both directly and indirectly.31
Based on research conducted on the administration of red rice to the effects of adipogenesis and inflammation on white adipose tissue, the presence of a phenolic compound called flavonoid is effective in inhibiting the infiltration of inflammatory cells, especially macrophages.32 The predominant flavonoids found in brown rice are tricin (75%), while the remaining flavonoids include luteolin, apigenin, quercetin, kaempferol, isorhamnetin, and myricetin.19 Quercetin, a type of flavonoid, is also effective in attenuating inflammation in mice with obesity conditions through three mechanisms. Quercetin suppresses the expression of CD11c+ and Nos2, which are the markers of M1 macrophages, thereby modifying the M1/M2 ratio in adipose tissue. In addition, quercetin suppressed the levels of proinflammatory cytokines TNF-α, IL-6, and MCP-1. It also impacts adenosine monophosphate-activated protein kinase (AMPK) α1, thus activating silent information regulator 1 (SIRT1) and inhibiting inflammation in macrophages. AMPK and SIRT1 serve as essential sensors of nutrients and regulators of inflammation.33
Conclusion
In summary, the inclusion of brown rice in the HFHFr diet, particularly in obese rats, improves adipocyte hypertrophy and reduces inflammation in adipose tissue. Brown rice, a whole grain that is rich in a variety of bioactive compounds, such as phenols, flavonoids, ORZ, phytosterols, and GABA, can be used as a functional food substitute for white rice. The consumption of brown rice is more advantageous than the consumption of gamma oryzanol alone.
Nevertheless, this investigation is subject to certain limitations. We have not investigated the pathways that influence macrophage infiltration and the inflammatory mediators that contribute to it. Additional research is also required to clarify the impact of brown rice on fat deposition in a variety of organs.
Acknowledgement
The authors are grateful to the Department of Doctoral Program in Medical Science, Faculty of Medicine, Universitas Brawijaya Malang, and the Department of Nutrition, Faculty of Health Sciences, Universitas Brawijaya Malang, for providing assistance throughout all aspects of the study. We also acknowledge team support from the Universitas Brawijaya laboratories: the Animal Research Laboratory, the Pharmaceutical Laboratory, the Central Laboratory of Biomedical Science, the Laboratory of Anatomical Pathology, the Laboratory of Clinical Pathology, and the Central Laboratory of Life Science.
Funding Sources
The author(s) received no financial support for the research, authorship, and/or publication of this article.
Conflict of Interest
The authors do not have any conflict of interest.
Data Availability Statement
This statement does not apply to this article.
Ethics Statement
The study protocol was approved by Health Research Ethics Commission of the Faculty of Medicine, Universitas Brawijaya, Malang, Indonesia, under approval No. 204/EC/KEPK- 53/ 08/2022.
Informed Consent Statement
This study did not involve human participants, and therefore, informed consent was not required.
Authors’ Contribution
L.S. (Laksmi Sasiarini): Conceptualization, Methodology, Data Collection, Writing – Original Draft
H.S. (Hidayat Sujuti): Supervision, Analysis and Interpretation of Data
D.H. (Dian Handayani): Supervision, Review and Editing Manuscript
A.R. (Achmad Rudijanto): Supervision, Review and Editing the Manuscript
References
- Hruby A.,Hu F.B. The epidemiology of obesity: a big picture. Pharmacoeconomics 2015;33(7):673-689. DOI: https://doi.org/10.1007/s11130-013-0366-9
CrossRef - Ogden C.L., Carroll M.D., Lawman H.G., Fryar C.D., Kruszon-Moran D., Kit B.K., Flegal K.M. Trends in obesity prevalence among children and adolescents in the united states, 1988-1994 through 2013-2014. JAMA 2016;315(21):2292. DOI: https://doi.org/10.1001/jama.2016.6361
CrossRef - Naher S., Hoque M.M., and Imam H. Obesity phenotypes and their adipocyte dysfunction among the attendants at outpatient department. BSMMU J 2018;11(2):112. DOI: https://doi.org/10.3329/bsmmuj.v11i2.36507
CrossRef - Li H., Ren J., Li Y., Wu Q., and Wei J. Oxidative stress: The nexus of obesity and cognitive dysfunction in diabetes. Front Endocrinol 2023;14:1134025. DOI: https://doi.org/10.3389/fendo.2023.1134025
CrossRef - Li Y., Goto T., Ikutani R., Lin S., Takahashi N., Takahashi H. Xanthoangelol and 4-hydroxyderrcin suppress obesity-induced inflammatory responses. Obesity 2016;24(11):2351-2360. DOI: https://doi.org/10.1002/oby.21611
CrossRef - Pincu Y., Yoel U., Haim Y., Makarenkov N., Maixner Z., Shaco-Levy R. Assessing obesity-related adipose tissue disease (OrAD) to improve precision medicine for patients living with obesity. Front Endocrinol 2022;13:860799. DOI: https://doi.org/10.3389/fendo.2022.860799
CrossRef - Bai Y., Sun Q. Macrophage recruitment in obese adipose tissue. Obesity Reviews 2015;16(2):127-136. DOI: https://doi.org/10.1111/obr.12242
CrossRef - Shimizu T., Yamakuchi M., Biswas K.K., Aryal B., Yamada S., Hashiguchi T. HMGB1 is secreted by 3T3-L1 adipocytes through JNK signaling and the secretion is partially inhibited by adiponectin. Obesity 2016;24(9):1913-1921. DOI: https://doi.org/10.1002/oby.21549
CrossRef - Chung K.J., Chatzigeorgiu A., Economopoulou M., Garcia-Matin R., Alexaki V.I., Mitroulis I. A self-sustained loop of inflammation-driven inhibition of beige adipogenesis in obesity. Nat Immunol 2017;18(6):654-664. DOI: https://doi.org/10.1038/ni.3728
CrossRef - Murata T., Yamaguchi M., Kohno S., Takahashi C., Risa W., Hatori K. Regucalcin enhances adipocyte differentiation and attenuates inflammation in 3T3-L1 cells. FEBS Open Bio 2020;10(10):1967-1984. DOI: https://doi.org/10.1002/2211-5463.12947
CrossRef - Kim J.I., Huh J.Y., Sohn J.H., Choe S.S., Lee Y.S., Lim C.Y. Lipid-overloaded enlarged adipocytes provoke insulin resistance independent of inflammation. Mol Cel Biol 2015;35(10):1686-1699. DOI: https://doi.org/10.1128/MCB.01321-14
CrossRef - Francisco V., Pino J., Campos-Cabaleiro V., Ruiz-Fernandez C., Mera A., Gonzalez-Gay M.A. Obesity, fat mass and immune system: role for leptin. Front Physiol 2018:9:640. DOI: https://doi.org/10.3389/fphys.2018.00640
CrossRef - Cinti S., Graciotti L., Giordano A., Valerio A., and Nisoli E. COVID-19 and fat embolism: a hypothesis to explain the severe clinical outcome in people with obesity. Internasional Journal of Obesity 2020;44:1800-1802. DOI: https://doi.org/10.1038/s41366-020-0624-5
CrossRef - Samjoo A., Safdar A., Hamadeh M.J., Raha S., and Tarnopolsky M.A. The effect of endurance exercise on both skeletal muscle and systemic oxidative stress in previously sedentary obese men. Nutr Diabetes 2013;3(9):e88. DOI: https://doi.org/10.1038/nutd.2013.30
CrossRef - Minatel I.O., Francisqueti F.V., CorrêaR., and Lima G.P.P. Antioxidant activity of γ-oryzanol: a complex network of interactions. Int J Mol Sci 2016;17(8):1107. DOI: https://doi.org/10.3390/ijms17081107
CrossRef - Jeyakumar S.M., Lopamudra P., Padmin S., Balakrishna N., Giridharan N.V., Vajreswari A. Fatty acid desaturation indeks correlates with body mass and adiposity indices of obesity in wistar NIN obese mutant rat strains WNIN/Ob and WNIN/GR-Ob. Nutrition & Metabolism. 2009;6(27). DOI: 1186/1743-7075-6-27
CrossRef - Pereira-Caro G., Cros G., Yokota T., and Crozier A. Phytochemical profiles of black, red, brown, and white rice from the camargue region of france. J Agric Food Chem 2013;61(33):7976-7986. DOI: https://doi.org/10.1021/jf401937b
CrossRef - Cho J.Y., Lee H.J., Kim G.A., Kim G.D., Lee Y.S., Shin S.C. Quantitative analyses of individual γ-oryzanol (steryl ferulates) in conventional and organic brown rice (oryza sativa l.). Journal of Cereal Science 2012;55(3):337-343. DOI: https://doi.org/10.1016/j.jcs.2012.01.005
CrossRef - Ravichanthiran K., Ma Z.F., Zhang H., Cao Y., Wang C.W., Muhammad S. Phytochemical profile of brown rice and its nutrigenomic implications. Antioxidants 2018;7(6):71. DOI: https://doi.org/10.3390/antiox7060071
CrossRef - Ghaben A.L., Scherer P.E. Adipogenesis and metabolic health. Nature Reviews Molecular Cell Biology 2019;20(4):242-258. DOI: https://doi.org/10.1038/s41580-018-0093-z
CrossRef - DiGirolamo M., Fine J.B., Tagra K., and Rossmanith R. Qualitative regional differences in adipose tissue growth and cellularity in male Wistar rats fed ad libitum. Am J Physiol Regul Integr Comp Physiol 1998;274(5):R1460-R1467. DOI: https://doi.org/10.1152/ajpregu.1998.274.5.R1460
CrossRef - Xiao L., Yang X., Lin Y., Li S., Jiang J., Qian S. Large adipocytes function as antigen-presenting cells to activate CD4+ T cells via upregulating MHCII in obesity. International Journal of Obesity 2016;40(1):112-120. DOI: https://doi.org/10.1038/ijo.2015.145
CrossRef - Majka Z., Czamara K., Janus J., Kępczyński, and Kaczor A. Prominent hypertrophy of perivascular adipocytes due to short-term high fat diet. Biochimica et Biophysica Acta (BBA) – Molecular Basis of Disease 2022;1868(2):166315. DOI: https://doi.org/10.1016/j.bbadis.2021.166315
CrossRef - Ho J.N., Son M.E., Lim W.C., Lim S.T., and Cho H.Y. Germinated brown rice extract inhibits adipogenesis through the down-regulation of adipogenic genes in 3T3-L1 adipocytes. Plant Foods Hum Nutr 2013;68(3):673-689. DOI: https://doi.org/10.1007/s11130-013-0366-9.
CrossRef - Gong E.S., Luo S.J., Li T., Liu C.M., Zhang G.W., Chen J. Phytochemical profiles and antioxidant activity of brown rice varieties. Food Chem 2017;227:432-443. DOI: https://doi.org/10.1016/j.foodchem.2017.01.093
CrossRef - Mir S.A., Shah M.A., Bosco S.J.D., and Sunooj K. A review on nutritional properties, shelf life, health aspects, and consumption of brown rice in comparison with white rice. Cereal Chemistry 2020;97(5):895-903. DOI: https://doi.org/10.1002/cche.10322
CrossRef - Li Y., Yun K., and Mu R. A review on the biology and properties of adipose tissue macrophages involved in adipose tissue physiological and pathophysiological processes. Lipids Health Dis 2020;19(1):164. DOI: https://doi.org/10.1186/s12944-020-01342-3
CrossRef - Lumeng C.N., DelProposto J.B., Westcott D.J., and Saltiel A.R. Phenotypic switching of adipose tissue macrophages with obesity is generated by spatiotemporal differences in macrophage subtypes. Diabetes 2008;57(12):3239-3246. DOI: https://doi.org/10.2337/db08-0872
CrossRef - Murano I., Barbatelli G., Parisani V., Latini C., Muzzonigro G., Castellucci M. Dead adipocytes, detected as crown-like structures, are prevalent in visceral fat depots of genetically obese mice. J Lipid Res 2008;49(7):1562-1568. DOI: https://doi.org/10.1194/jlr.M800019-JLR200
CrossRef - Cinti S., Mitchell G., Barbatelli G., Murano I., Ceresi E., Faloia E. Adipocyte death defines macrophage localization and function in adipose tissue of obese mice and humans. J Lipid Res 2005;46(11):2347-2355. DOI: https://doi.org/10.1194/jlr.M500294-JLR200.
CrossRef - Ruggiero A.D., Key C.C.C., and Kavanagh K. Adipose tissue macrophage polarization in healthy and unhealthy obesity. Front Nutr 2021;8:625331. DOI: https://doi.org/10.3389/fnut.2021.625331.
CrossRef - Munkong N., Lonan P., Mueangchang W., Yadyookai N., Kanjoo V., and Yoysungnoen B. Red rice bran extract attenuates adipogenesis and inflammation on white adipose tissues in high-fat diet-induced obese mice. Foods 2022;11(13):1865. DOI: https://doi.org/10.3390/foods11131865
CrossRef - Dong J., Zhang X., Zhang L., Bian H.X., Xu N., Bao B. Quercetin reduces obesity-associated ATM infiltration and inflammation in mice: a mechanism including AMPKα1/SIRT1. J Lipid Res 2014;55(3):363-374. DOI: https://doi.org/10.1194/jlr.M038786
CrossRef

This work is licensed under a Creative Commons Attribution 4.0 International License.


