
Introduction
In recent years, food consumption patterns in Indonesia have shifted away from traditional cuisines and towards high-fat, low-fiber fast food. In general, the risk of diabetes and heart disease is significantly increased by consuming fast food. Diabetes mellitus arises from alterations in insulin function, insulin production, or both, leading to elevated blood sugar levels.1 In 2017, reported that 425 million adults between the ages of 20-79‘old are at risk of developing diabetes according to the International Diabetes Federation (IDF). They predicted that this figure would increase by 54.7% to 642 million by 2045.2 These circumstances necessitate the creation of functional food products.
Functional foods, or nutraceuticals, undergo alterations or processing to yield targeted physiological or nutritional.3 Calcium, ascorbic acid, B vitamins, and antioxidant vitamins are common nutrients found in nutraceuticals. Synbiotic biscuit is one of the product functional that give good nutrition. A synbiotic biscuit contains prebiotic ingredients as well as probiotic bacteria. Probiotic product is considered at least 7 Log CFU/g probiotic bacteria based on the Food and Agriculture Organization (FAO).4
A synergistic combination of probiotics and prebiotics may lower blood glucose levels. One of the impacts of beneficial antioxidants produced by some probiotic strains against chronic inflammation is their ability to diminish chronic inflammation and pancreatic cell death.5 In addition, undigested carbohydrates will pass through the upper digestive system undamaged and fermented by anaerobic cecum and colonic microbes in the cecum and large intestine. The most prevalent products were several types of fermented Short-Chain Fatty Acid (SCFAs) metabolites. The liver eliminates most propionate and butyrate from the portal circulation to prevent high levels of SCFAs in the bloodstream. Propionate is a precursor for hepatic gluconeogenesis in the liver.6
The synbiotic biscuits are made from a mixed flour of banana corm, sweet potatoes, and black soybeans, all possessing beneficial properties. The synbiotic biscuits are functionalized biscuits that have been modified and enhanced to provide additional health benefits beyond basic nutrition. Biscuits with healthier flour replace some of the saturated fat, and sugar levels, and gluten-free. Biscuits made from Urad bean by Ali et al.7 reported Urad bean flour has been shown to replace some of the saturated fat in biscuits without significantly compromising their taste or texture, offering a healthier alternative that still satisfies consumer preferences. Besides that, biscuits with cocoa bean shells as functionalized biscuits benefit the diabetic consumer. Rojo-Poveda et al.8 reported that cocoa bean shell flour replaces sucrose with tagatose and biscuits accepted by consumers.
The Glycemic Index (GI) quantifies the impact of a carbohydrate-containing meal on blood sugar levels in comparison to a reference dish devoid of carbohydrates, usually utilizing glucose or white bread as the benchmark. The original intent of the Glycemic Index (GI) for diabetes was to function as a tool for meal preparation and to provide guidance on choosing foods with a low GI.9 Nevertheless, there is no GI value for a synbiotic biscuit. An investigation is required to study the Glycemic Index (GI), Glycemic Load (GL), and the impact of consuming synbiotic biscuits on blood glucose levels in Wistar rats, as outlined. Therefore, to investigate the Glycemic Index (GI) and Glycemic Load (GL) of synbiotic biscuits made from composite flour of banana corm, sweet potatoes, and black soybeans, and their impact on blood glucose levels in Wistar rats, filling the gap in current GI values for such functional foods.
Materials and Methods
Materials
Materials of the research were a local banana corm flour, sweet potato flour Ace varieties, black soybean flour Akibe 1 varieties, pure culture of L. acidophilus, metformin, aquades, standard feed (C.551), glucose, alloxan monohydrate, 0,9% NaCl, GOD-PAP reagent (Glucose Oxidase Phenol 4-Aminoantipyrine), 0.85% saline solution, MRS broth medium and MRS medium agar, and glacial acetic acid.
The equipment includes a bowl, mixer, spoon, spatula, rolling pin, mixer, tray, and vacuum oven. The analysis includes an analytical scale, Erlenmeyer flask, Petri dish, reaction tube, tube shelf, bulb pipette, and bunsen.
The study utilized an incubator (VWR, USA), Microscope (Scientific Olympus, Japan), Colony counter (Funke Gerber, German), Spectrophotometer (Lambda 35, PerkinElmer, USA), and a glucometer.
The experimental subjects were white male Wistar rats, with 2-3 month-old, and weighing between 150-200 g.
Methods
This study employs an experimental approach to evaluate the effect of synbiotic biscuit consumption on blood glucose levels in Wistar rats. This study utilizes regression statistics with treatment groups including a negative control, a positive control, and experimental groups with varying doses of synbiotics.
Glycemic Index (GI) Assay
A common method for calculating the glycemic index (GI) is the Incremental Area Under the Curve (IAUC) approach.10 The glycemic index of the food was established by feeding three Wistar rats. The mice’s fasting blood glucose levels were assessed the morning after a 10-12 hour fast. Blood glucose levels were evaluated at 30, 60, 90, and 120 min after consuming synbiotic cookies with 50g of carbohydrates. Wistar rats received the same treatment with regular pure glucose meal (GI = 100). The results of reference foods are compared to those of each product.
The IAUC was determined using the trapezoidal method for each test product and compared with the Area Under the Curve (AUC) of the reference foods. The space below the baseline (fasting point) is ignored. The Glycemic Index (GI) was calculated by comparing the areas under the curve of a standard food with the curve of the test food. The AUC is calculated using the following formula:
Area A = 1/2 (a x (30-0)),
Area B = 1/2 (a + b) x (60-30),
Area C = 1/2 (b + c) x (90-60),
Area D = 1/2 (c + d) x (120-90),
AUC = area A + area B + area C + area D
Glycemic Load (GL) Assay
The Glycemic Load of a food is determined by multiplying the Glycemic Index (GI) of the item by the quantity of carbs in the portion ingested.11
Treatment of Animals
There were four groups, each consisting of three rats. The mice were acclimatized in a controlled environment at 23-25 °C for seven days, following a 12-hour light/dark cycle. Mice fasted for 12 hours seven days prior to the fasting blood glucose test.1
The fasting rats were injected intravenously with 125 mg/kg of alloxan monohydrate, dissolved in NaCl-Fis. It should be used fresh and prepared right prior to administration. Animals with 200-400 mg/dl of blood glucose levels after 72 hours were selected and tested for hyperglycemia.
Group 1 was provided with distilled water as a negative control;
Group 2 was provided with suspended metformin (45 mg/kg body weight) as the standard drug in the carrier (positive control); and
Groups 3 and 4 were provided with synbiotic biscuits suspended in a carrier at a dose of 5 g and 10 g in a volume of 10 mL of distilled water, respectively.
Blood was drawn from rats’ tail veins. The medication was continued for the next 15 days, and blood samples and body weight were obtained on 3, 6, 9, 12, and 15 days. Note that blood glucose levels were estimated using the GOD kit at various time intervals.
Glucose Concentration with GOD-PAP Method
Glucose Concentration with GOD-PAPA by Nguyen et al.12 Combine 1000 L GOD-PAP reagent with 10 L sample or 10 L standard that served as sample or standard, and 1000 L GOD-PAP reagent with 10 L distilled water as the blank. Incubation was conducted for 20 minutes at a temperature of 20 – 25°C or for 10 minutes at a temperature of 37 °C. Within 60 minutes, the absorbance blank was read. The following calculations were made using the standard:

Total Bacteria Probiotic on Faeces with Total Plate Count Method
To calculate the total probiotic bacteria in faeces using the total plate count method by Grymezescu.13 A 1 g sample was first diluted in 3 mL of MRS broth (pH 4 with glacial acetic acid) and then incubated at 37 °C for 1-2 hours. Aseptically mix 0.1 mL of a sample with 0.9 mL of a 0.85% NaCl solution to create a final dilution factor of 10-6. Aliquots of each 0.1 mL from the previous three dilutions were placed in an MRS medium and 1% CaCO3 and incubated at 37 °C for 48 hours using the spread plate technique.13 The number of colonies formed on MRS Agar was determined using a specific equation:

Statistical Analysis
The experimental method was the descriptive method followed by correlation and regression analysis to observe blood glucose levels and the rat faeces using SPSS Program.
Results and Discussions
Synbiotic foods, which combine probiotics and prebiotics, have been studied for their health benefits, including gut health improvement and potential impacts on metabolic conditions. The use of composite flour made from banana corm, sweet potatoes, and black soybeans is particularly innovative. Each of these ingredients brings unique nutritional properties to the biscuits, such as high fiber content, essential vitamins, and antioxidants, which are beneficial for blood sugar management and overall health. Synbiotic biscuits could be integrated into their diet as a supplementary food item to help regulate blood sugar levels, alongside other dietary and lifestyle interventions. This could offer a more enjoyable and sustainable way to manage diabetes, enhancing adherence to dietary recommendations and potentially improving quality of life.
Glycemic Index
The Glycemic Index (GI) serves as a crucial tool for classifying foods based on their impact on blood sugar levels. Various factors influence the glycemic index of a food, there are types of carbohydrates, fiber content, and food processing. According to the research, the total amount of starches and total sugars in synbiotic biscuits is 54.44% and 8.36%, respectively. Standard food (pure glucose) and test food (synbiotic biscuit) both contain 50 g of accessible carbohydrates, as determined by the total amount of starches and total sugars in the synbiotic biscuit. Available carbohydrate refers to the carbohydrates that can be broken down and absorbed in the small intestine of humans, contributing to glucogenesis.14 The amount of test food (Synbiotic biscuits) is presented in Table 1.
Table 1: The amount of Test Food (Synbiotic biscuit)
|
Parameters |
Mean |
|
Mass of Synbiotic Biscuit (g) |
1.32 |
|
Available Carbohydrate (%) |
68.24 |
|
Starches (%) |
54.44 |
|
Total sugars (%) |
8.36 |
The glycemic index of synbiotic biscuits insights into their potential health benefits, particularly for blood sugar management. The presence of Lactobacillus acidophilus, prebiotic ingredients, and composite flour in the synbiotic biscuits may contribute to their glycemic response. The probiotics and prebiotics could influence gut health, which in turn might affect glucose metabolism and insulin sensitivity, leading to improved glycemic control. Table 2 displays the glycemic index values for Synbiotic Biscuit (test food) and pure glucose.
Table 2: Glycemic Index of Synbiotic Biscuit
|
Food |
GI |
|
Glucose (Pure Food) |
100 |
|
Synbiotic biscuit (Test Food) |
65.38 |
According to Table 2, a moderate GI characterizes the synbiotic biscuit (65.38). They contain much starch, which is slower to digest and absorb than glucose. Starch not only lowers postprandial glycemia in this form, but it also influences satiety.15 Foods are rated on a scale from 0 to 100, with higher scores, and recommend meals that cause a rapid increase in blood glucose levels. The synbiotic biscuits may provide a balanced energy release, aiding in improved blood sugar regulation, as suggested by their mild GI and the observed drop in blood glucose levels in Wistar rats.
USDA National Nutrient Database For Standard 16 investigated the GI values of sweet potato and black soybean (GI = 44 and 31, respectively). According to their data, synbiotic biscuits have the highest GI value. These two components explain more GI variability than processing and starch content (in terms of composition). Furthermore, this procedure gelatinizes starch, allowing it to be quickly digested and absorbed.17
Low-GI foods are associated with improved prevention and control of metabolic and cardiovascular disorders, like diabetes and myocardial infarction, because of the challenge of anticipating their impact in varied diets.18 Low-GI carbohydrates with slow digestion and absorption cause a low glycemic response. Conversely, the high glycemic response is induced by high GI carbohydrates that are rapidly digested and absorbed. 19
Glycemic Load
Glycemic Load (GL) is a nutritional metric that combines the Glycemic Index (GI) with the quantity of carbs in a serving of food, providing a more comprehensive understanding of how food affects blood sugar levels. Glycemic load (GL) quantifies the real effect on blood sugar by considering both the rate of glucose absorption and the quantity of carbohydrates ingested. The GL of the test food (Synbiotic biscuits) is presented in Table 3.
Table 3: Glycemic Load of Synbiotic Biscuit.
|
Parameters |
Synbiotic biscuit |
|
Serving Size (g) |
30 |
|
Available Carbohydrate/serving |
20.47 |
|
GL |
13.38 |
Table 3 provides the GL values of the synbiotic biscuit. According to Table 3, a modest GL characterizes the synbiotic biscuit (13.38Meals with a high glycemic load cause a greater increase in blood glucose levels compared to meals with a low glycemic load. Postprandial hyperglycemia is triggered by the consumption of high-glycemic load foods. This is considered detrimental since it leads to prolonged elevation of blood glucose levels.20 The relationship between meal glycemic load (GL) and blood glucose levels was deemed statistically significant.21
Body Weight
Diabetes caused by alloxan significantly reduces the rat’s body weight. Since the structure of alloxan is similar to that of glucose, it can compete with glucose for the attention of cells with glucoreceptors.22 Since these cells reduced their glucose intake, they reduced their energy reserves (fat) and glycogen, preventing weight gain.23 Figure 1 depicts the weight fluctuations of the rats.
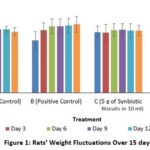 |
Figure 1: Rats’ Weight Fluctuations Over 15 days. |
Figure 1 illustrates the fluctuations in control and treatment body weight during 15 days from day 0 to day 15. The negative control rats’ weight loss was caused by their inability to use glucose produced from the diet as an energy source. According to Szkudelski et al.24, alloxan is a hazardous glucose analog that specifically damages insulin-producing cells (beta cells) in the pancreas. Since insulin insufficiency prevents glucose from entering body cells, the body’s energy requirements are met by lipolysis. To generate energy, fats in diverse tissues are mobilized and destroyed by a process known as beta-oxidation. Weight loss is primarily due to fat loss. The study found that treatment with metformin (positive control), 5 g of synbiotic biscuit in 10 ml (Group C), and 10 g of synbiotic biscuit in 10 ml (Group D) led to a significant improvement in body weight. Metformin lowers fasting plasma glucose concentrations by stimulating pancreatic beta cells to make insulin. Moreover, insulin stimulates the liver to convert glucose into triglycerides, which are then turned into glycogen and can be used as an energy store.23 Hence, weight gain would have resulted from increased glycogen storage.
Blood Glucose Levels
According to the statistical analysis, there is a relationship between the administration of water, oral diabetes medications, and synbiotic biscuits and blood glucose levels. The slope values in the negative control, positive control, Groups C and D are -8.2241, -4.094, -2.801, and -7.0184, respectively. Negative readings suggest a drop in blood glucose levels when water, oral diabetes medications, and synbiotic biscuits are administered. Figure 2 illustrates the association between blood glucose levels and the administration of water, oral antidiabetic medications, and synbiotic cookies.
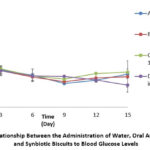 |
Figure 2: The Relationship Between the Administration of Water, Oral Antidiabetic Drugs, and Synbiotic Biscuits to Blood Glucose Levels |
Figure 2 displays that blood glucose levels in the negative control, positive control, Groups C and D were greater than 126 mg/dl 72 hours after alloxan administration. Alloxan (125 mg/kg body weight) produces recurrent diabetes mellitus in male Wistar rats, as demonstrated by an increase in serum glucose concentration. Chronic hyperglycemia in alloxan-induced rats during the experiment was caused by beta-cell death, as previously reported by Agunbiade et al.25
According to Figure 2, the blood glucose levels in the negative control declined significantly from day 0 to day 9, then climbed till day 15. This occurred due to the fact that the death of pancreatic beta cells was not too severe, allowing the rats in negative control to reduce blood glucose levels naturally through their body metabolism.26 In diabetic rats, there was a recovery in beta cell expression that was immunoreactive with insulin on day 28 of observation, driven by the pancreas’s ability to regenerate beta cells.
This study discovered that taking oral diabetes medications (metformin) led fasting blood glucose levels to drop for 15 days, even if they did not return to normal. Combining metformin and sulfonylurea improves glycemic control in type 2 diabetes more efficiently than either medication alone, according to Tosi et al.25 Note that the dose of each medicine can also be reduced. Furthermore, the administration of synbiotic cookies reduced fasting blood glucose levels for 15 days. This happened due to the antioxidant properties of lactic acid bacteria acting as probiotics. Beneficial antioxidants from certain probiotic strains can help reduce chronic inflammation and prevent pancreatic cell loss.5 Additionally, administering multispecies probiotics before treatment enhances mucosal Glutathione (GSH) levels, leading to increased GSH production in the ileum. Oxidative mucosal damage is decreased as a consequence.28
Prebiotics promote the proliferation and activity of helpful microorganisms in the gastrointestinal tract. They pass through the digestive tract without being broken down by digestive enzymes and are then fermented in the cecum and large intestine by anaerobic microorganisms. The predominant products were different types of fermented short-chain fatty acids (SCFAs) which included acetate, propionate, and butyrate with carbon chains varying from 1-6. The liver removes the majority of propionate and butyrate from the portal circulation to avoid elevated levels of SCFA in the bloodstream. Propionate acts as the precursor for gluconeogenesis in the liver.6 The study found that administering diabetics 10 g in 10 mL of synbiotic biscuit for 15 days significantly decreased fasting blood glucose levels. A synbiotic cookie contains a higher dose when it has a greater amount of prebiotics and probiotic microorganisms.
Total Probiotic Bacteria L. acidophilus in Faeces
Examined data shows a relationship between eating synbiotic cookies and the existence of L. Acidophilus as probiotic bacteria. This is illustrated by slope values of +0.0955 in Group C and +0.0787 in Group D. Figure 3 depicts the relationship between consuming synbiotic biscuits and the presence of L. acidophilus probiotic bacteria in faeces.
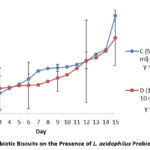 |
Figure 3: Impact of Synbiotic Biscuits on the Presence of L. acidophilus Probiotic Bacteria in Faeces |
The treatment D has a much higher Coefficient of Determination (R2) than the other treatments, as observed in Figure 3. Treatment D considerably affects the overall number of probiotic bacteria in feces. More probiotic bacteria are present in synbiotic biscuits when the dose increases. On day 0 of the trial, the average total probiotic bacteria in faeces ranged from 5.11 to 5.15 Log CFU/g, and on day 15, it increased to 6.56 to 7.02 Log CFU/g. According to Gross et al.29, there were considerably more Lactobacillus in the L. plantarum-treated animals (106 CFU/g) than in the control animals (105 CFU/g). These findings suggest that L. acidophilus may overcome gastrointestinal tract obstructions like low pH, gastric enzymes, and bile salts. Lactobacillus spp can adhere to the intestinal mucosa because of the presence of adhesin.30
Inulin employed as a prebiotic in synbiotic biscuits is fermented to produce SCFA. Mucosal growth utilizes short-chain fatty acids (SCFA) for energy and may promote the proliferation of probiotic bacteria in the faeces. The amount of mucin generated increases with the rate of intestinal mucosa growth. Furthermore, one of the most crucial sources of nourishment for lactic acid bacteria growth is mucin.31 According to Roberfroid et al.32, giving 20 and 40 g/d of inulin caused a noticeably higher quantity of bifidobacterial in the faeces (107.9-108.8 and 109.2, respectively).
Conclusion
The synbiotic biscuits have the potential to reduce blood sugar levels in Wistar white rats. The study revealed that rats who ate synbiotic cookies had lower blood glucose levels compared to the control group. This indicates that synbiotic biscuits may be a promising method for controlling human blood sugar levels. Additional research is needed to ascertain the safety and efficacy of synbiotic biscuits in humans and to find the ideal dosage and treatment period. The study’s results offer useful insights into the possibility of synbiotic cookies as a dietary intervention for controlling blood sugar levels.
Acknowledgments
The authors are grateful to the Rector of Universitas Padjadjaran and all those who contributed to this work.
Funding Sources
The author’s financial funding is from by Riset Kompetensi Dasar UNPAD (RKDU), Hibah Internal UNPAD, Indonesia.
Conflict of Interest
No conflict of interest in this work.
Author’s Contribution
Data accuration: S.D.M., I.N.H and S.F.K.; Conceptualization, S.D.M., I.N.H.; Methodology, V.P.Y., E.L.Z., and E.N.W.; writing, S.D.M., I.N.H and S.F.K.; review and editing, I.N.H., E.N.D., V.P.Y., and M.N.L.; visualization, S.M.D and S.F.K.
Data Availability Statement
Data within the article will be provided upon a justified request.
Statement of Ethics
The study followed the ethical guidelines of RESEARCH ETHICS UNIVERSITAS PADJADJARAN with No.122/UN6.KEP/EC/2021. All experimental protocols involving animals were reviewed and approved.
References
- Lucchesi A. N., Cassettari L. L., and Spadella C. T. Alloxan-induced diabetes causes morphological and ultrastructural changes in rat liver that resemble the natural history of chronic fatty liver disease in humans. Journal of Diabetes Research. 2015;2015
CrossRef - Webber S. IDF Diabetes Atlas. 8th ed. Diabetes Research and Clinical Practice; 2017.
- Bharti J. Relationship Of Nutrition , Food Science And Nutrional Psychology. Strad Research; 2021
- FAO/WHO. Guidelines For The Evaluation Of Probiotics In Food. Geneva: Food And Agriculture Organization Of The United Nations And World Health Organization Working Group Report. 2002
- Zhang Y., Zhang H. Microbiota associated with type 2 diabetes and its related complications. Food Science and Human Wellness. 2013;2(3-4):167-172.
CrossRef - Den B. G., Van E. K., Groen A. K., Venema K., Reijngoud D. J, Bakker B. M. The role of short-chain fatty acids in the interplay between diet, gut microbiota, and host energy metabolism. Journal Lipid Research. 2013;54(9):2325-2340.
CrossRef - Peng X., Liu H., Li X., Wang H., Zhang K., Li S., Bao X., Zou W., Yu W. Predicting the Glycemic Index of Biscuits Using Static In Vitro Digestion Protocols. Foods. 2023;12(2). DOI: 10.3390/foods12020404.
CrossRef - Ali S. A., Saeed S. M. G., Sohail M., Elkhadragy M. F., Yehia H. M., Giuffrè A. M. Functionalization of pre-gelatinized Urad bean fermented by Saccharomyces cerevisiae MK-157 as a fat replacer and its impact on physico-chemical, micromorphology, nutritional and sensory characteristics of biscuits. Arab J Chem. 2023;16(9).
CrossRef - Venn B. J., Green T. J. Glycemic index and glycemic load: Measurement issues and their effect on diet–disease relationships. European Journal of Clinical Nutrition. 2007;61(May):S122-S131.
CrossRef - Miller, J.B. The G.I. Factor: The Glycaemic Index Solution. 2nd ed. Hodder & Stoughton Ltd; 1999
- Wolever T. M. S., Mehling C., Chiasson J. L., Josse R. G., Leiter L. A., Maheux P., Rabasa-Lhoret R., Rodger N. W., Ryan E. A. Low glycaemic index diet and disposition index in type 2 diabetes (the Canadian trial of Carbohydrates in Diabetes): A randomised controlled trial. Diabetologia. 2008;51(9):1607-1615. DOI: 10.1007/s00125-008-1093-x.
CrossRef - Ngoc N. Blood glucose and enzyme analysis methods of case in Vietnam degree program in chemistry and technology. Centria University of Applied Sciences. 2018:1-35.
- Grumezescu A. M., Holban A. M. Natural And Artificial Flavoring Agents And Food Dyes. 1st ed. Andre Gerhard Wolff; 2017.
CrossRef - Eleazu C. O. The concept of low glycemic index and glycemic load foods as panacea for type 2 diabetes mellitus; prospects, challenges and solutions. Afrrican Health Science. 2016;16(2):468-479.
CrossRef - Burton-Freeman B., Davis P. A., Schneeman B. O. Plasma cholecystokinin is associated with subjective measures of satiety in women. American Journal of Clinical Nutrition. 2002;76(3):659-667.
CrossRef - USDA National Nutrient Database for Standard Reference R 25. Sweet Potato, Soy Bean, Butter, Margarine.
- Peng X., Liu H., Li X., Wang H., Zhang K., Li S., Bao X., Zou W., Yu W. Predicting the Glycemic Index of Biscuits Using Static In Vitro Digestion Protocols. MDPI Foods Journal. 2023;12(2). DOI: 10.3390/foods12020404.
CrossRef - Marangoni F, Poli A. The glycemic index of bread and biscuits is markedly reduced by the addition of a proprietary fiber mixture to the ingredients. Nutrition, Metabplism & Cardiovascular Diseases. 2008;18(9):602-605.
CrossRef - Arif A. B., Budiyanto A., Hoeruddin Glicemic Index of Foods and Its Affecting Factors. Jurnal Litbang Pertanian. 2013;32(2):91-99.
CrossRef - Yalcin T., Al A., Rakıcıoğlu N. The Effects Of Meal Glycemic Load On Blood Glucose Levels Of Adults With Different Body Mass Indexes. Indian Journal of Endocrinology and Metabolism. 2017;21(1):71. Available From: http://www.ijem.in/text.asp?2017/21/1/71/195995.
CrossRef - Bhupathiraju S. N., Tobias D. K, Malik V. S., Pan A., Hruby A., Manson J. E., Willet W. C., Hu F. B. Glycemic index, glycemic load, and risk of type 2 diabetes: Results from 3 large US cohorts and an updated meta-analysis. American Journal Clinical Nutrition. 2014;100(1):218-232. DOI: 10.3945/ajcn.113.079533.
CrossRef - Fajarwati I., Solihin D. D., Wresdiyati T., Batubara I. Self-recovery in diabetic Sprague Dawley rats induced by intraperitoneal alloxan and streptozotocin. Heliyon. 2023;9(5):e15533.
CrossRef - Sherwood L. Human Physiology : From Cells To Systems. 7th Ed. Brooks/Cole; 2010.
- Lenzen S. The mechanisms of alloxan- and streptozotocin-induced diabetes. Diabetologia. 2008;51(2):216-226.
CrossRef - Agunbiade O. S., Ojezele O. M., Ojezele J. O., Ajayi A. Y. Hypoglycaemic activity of commelina Africana and ageratum conyzoides in relation to their mineral composition. African Health Sciences. 2012;12(2):198-203.
CrossRef - Husain A., Alouffi S., Khanam A., Akasha R., Farooqui A., Ahmad S. Therapeutic Efficacy of Natural Product ‘C-Phycocyanin’ in Alleviating Streptozotocin-Induced Diabetes via the Inhibition of Glycation Reaction in Rats. International Journal of Molecular Sciences. 2022;23(22).
CrossRef - Edla S., Syama S. B. New analytical method development and validation for the simultaneous estimation of metformin and glibenclamide in bulk and tablet dosage form using RP-HPLC. Rasayan Journal of Chemistry. 2014;7(1):55-63.
CrossRef - Lutgendorff F., Nijmeijer R. M., Sandström P. A., Trulsson L. M., Magnusson K. E., Timmerman H. M., Minnen L. P. V., Rijikers G. T., Gooszen H. G., Akkermans L. M. A., Soderholm J. D. Probiotics prevent intestinal barrier dysfunction in acute pancreatitis in rats via induction of ileal mucosal glutathione biosynthesis. PLoS One. 2009;4(2). DOI: 10.1371/journal.pone.0004512
CrossRef - Gross G., Wildner J., Schonewille A., Rademaker J. L. W., Van M. R. D, Snel J. Probiotic Lactobacillus plantarum 299v does not counteract unfavorable phytohemagglutinin-induced changes in the rat intestinal microbiota. Applied Environmental Microbiology. 2008;74(16):5244-5249. DOI: 10.1128/AEM.00514-08.
CrossRef - Tassell M. L., Miller M. J. Lactobacillus adhesion to mucus. Nutrients. 2011;3(5):613-636.
CrossRef - Salaj R., Štofilová J., Šoltesová A., Hertelyová Z., Hijová E., Bertková I., Strojny L., Kruzliak P., Bomba A. The effects of two Lactobacillus plantarum strains on rat lipid metabolism receiving a high fat diet. The Scientific World Journal. 2013;2013.
CrossRef - Baba Y., Saito Y., Kadowaki M., Azuma N., Tsuge D. Effect of Continuous Ingestion of Bifidobacteria and Inulin on Reducing Body Fat: A Randomized, Double-Blind, Placebo-Controlled, Parallel-Group Comparison Study. Nutrients. 2023;15(24).
CrossRef

This work is licensed under a Creative Commons Attribution 4.0 International License.


