
Introduction
With over a third of undernourished adults globally, malnutrition is a significant health crisis in India.1 While a significant portion of its population still grapples with undernourishment, especially among children and marginalized communities, there is a rapid increase in the incidence of obesity and metabolic disorders due to changing diets and sedentary lifestyles.2 Previous studies support that less educated and socioeconomically disadvantaged adults, as well as rural dwellers tend to be underweight, while individuals with a higher wealth index, likely living in urban areas, are more likely to be overweight.3 This trend seems to be changing with the unprecedented increase in obesity rates, in both, rural and urban India, which has doubled for men and risen 62% for women, as reported in 2019.4
Concurrently, the escalating number of non-communicable diseases (NCDs) is another facet of the undernutrition and obesity paradox, which imposes a sizeable health and economic burden in India.5 A 2023 study, for example, estimated the number of diabetics in India to be 101 million people, a significant rise from the 2019 World Health Organisation (WHO) estimate of 77 million. The number of prediabetics was also estimated to be five-fold higher.6 NCDs are chronic diseases that are characterized by their slow progression and long duration, where poor nutrition and lifestyle, and inactivity, intensify oxidative damage and age-related decline. These also include, but are not limited to, cardiovascular diseases (CVD), chronic respiratory disease, neurodegenerative diseases, cancer, and chronic kidney disease.7 They are known to take root in our third and fourth decades of life, and are preventable and treatable with better eating and lifestyle practices. 8,9
The seemingly complex dietary paradox of undernutrition and obesity is further compounded by disparities in access to nutritious foods, lack of awareness, and limited policy interventions and healthcare infrastructure.4 Despite considerable income growth seen in India, there has not been an equivalent decrease in the prevalence of undernutrition, as represented by the persistence of anemia, childhood stunting and malnutrition amongst women and children. The growth of NCD’s, often associated with overnutrition, is further evidence of the undernutrition-obesity paradox.4 More than quantity, food quality appears to be correlated with malnutrition. Having access to varied sources of food helps ensure that our diet is sufficient in not only calories but also in micronutrients.10,11 The lack of nutrition education, however, may be an unexpected obstruction to malnutrition and NCD prevention.
With these facts at hand, researchers in India have started to investigate the extent of the dual undernutrition-obesity crisis and the variations amongst its substantial, disparate population. As part of this endeavour, this study focused on a high-risk, urban population that is formally educated, has access to information and the means to purchase quality food from a variety of sources. Working professionals yet have a high risk of developing NCDs, due to their sedentary lifestyle and eating patterns.3 Furthermore, understanding nutrient intake is also imperative to measure how eating patterns and supplement intake were altered by the COVID-19 pandemic, which has also increased NCD risk.12 The aim of this study was to investigate nutrient intake in Indian professionals and address this knowledge gap, which may help mitigate the risk of NCDs. The food intake of professionals in Mumbai, aged 30-40 years, allowed the calculation of energy, macronutrients and micronutrients in this culturally diverse population.
Methods
Study Design
A cross-sectional study was undertaken within the urban setting of Mumbai city, Maharashtra State of India, focusing on corporate employees. Mumbai, being a cosmopolitan hub, was chosen as the study location to capture the diverse cultural and ethnic spectrum of the Indian population. Ethical approval was obtained from an independent ethics committee, Bay View Clinic (MCGB Reg. No. 887302745).
Sample Size Determination
An age range of 30-40 years for participants was determined due to NCDs taking root in this age group, and to exclude access as a confounding factor. The prevalence of micronutrient deficiencies in India have been highlighted by previous research 13,14, with estimates of its incidence ranging between 40-70%. Accordingly, the sample size was determined utilizing a hypothesized frequency of 50%, an 85% confidence level, and a 5% confidence interval. Factoring in potential incomplete data and dropouts, an additional 10% of participants were incorporated, resulting in a final recruitment target of 220 individuals.
Sample size formula n = [DEFF*Np(1-p)]/ [(d2/Z21-α/2*(N-1) +p*(1-p)]
n =[1*(1000000*0.5*0.5)/ [(0.05^2/ (1.43^2) *(1000000-1)) +(0.5*0.5)]
n = 204
+10% extra, n = 220
Study Participants
The study employed a purposive sampling technique with voluntary participation.
Ten corporate offices were approached and the human resource department of the company were explained in the detail regarding the purpose of study. Permission was obtained from 6 corporate office to collect data. Professionals working in these offices were thoroughly briefed on the study’s protocol. Those who agreed to participate in the study were enrolled via an online form and written informed consent was secured. Screening for inclusion and exclusion criteria was then conducted among the participants.
Participants included in the study were (a) residing in Mumbai; (b) were 30-40 years old; (c) and worked in a corporate environment. Individuals with a history of any chronic illness (like diabetes mellitus, hypertension, heart disease etc.), pregnant and lactating women and individuals on a weight management diet were excluded from the study.
One of the study’s objectives was to evaluate nutrient intake variations based on food habits and gender. Participants who do not consume meat, eggs, and seafood were classified as vegetarians, while those consuming eggs or meat were categorized as non-vegetarians.
Data Collection
Data was collected through face-to-face interviews with a qualified clinical nutritionist. Demographic information, height and weight were recorded using a questionnaire-interview hybrid technique. Dietary data was obtained via a 24-hour recall method, of one weekday and one weekend day, enabling the calculation of dietary nutrient intake, and to adjust for varied eating patterns on the weekend. Visual aids, including standardized cups, spoons, and paper cut-outs of varying roti/chapati sizes, were used to facilitate accurate visual estimation of portion sizes and consumption of cooked foods.
A bespoke Food Frequency Questionnaire (FFQ), the most commonly used dietary instrument in epidemiologic studies, was used to gather insights into the frequency of various food consumption patterns. FFQs also help capture usual food intake with a single questionnaire, omitting the requirement of repeated contact with participants and is semi-quantitative.15 Food items were categorized into the following groups: cereals and millets, pulses and legumes, green leafy vegetables, roots and tubers, other vegetables, nuts and oilseeds, fruits, animal foods, and dairy products.
Participants’ macronutrient and micronutrient intake was calculated utilizing the standardized software DietCal, developed by Profound Tech Solutions in New Delhi. The nutrient content data in the software was sourced from the Indian Food Composition Tables.16 The software facilitated the computation of the average dietary nutrient intake over a 2-day period. For estimating participants’ iodine consumption, the FFQ data was cross-referenced with scientific publications by Gostas et al. (2020) and Longvah et al. (1998).17,18 As both the IFCT and DietCal software lack iodine content data for foods, iodine intake was calculated from the FFQ data, as previously described.19 Together, the 2-day diet recall and the FFQ helped corroborate the data acquired.
In a subset of agreeable individuals, body composition data, including body fat, skeletal muscle mass and visceral fat, was acquired using bioelectrical impedance analysis equipment, Omron Karada Scan Body Composition Monitor HBF-375 (Omron Corporation, Japan). Height, weight and body composition was assessed non-invasively, and was based on voluntary participation.
Data Calculations
The Nutrient Adequacy Ratio (NAR) for energy, macronutrient and micronutrients was calculated using individual 24-hour diet recall data. The NAR for a specific nutrient is an individual’s intake as a percentage of the Estimated Average Requirement (EAR) or Adequate Intake (AI), as advised by the Indian Council of Medical Research (ICMR)- National Institute of Nutrition (NIN) 2020 guidelines (Supplementary Table 1). EAR, the daily average nutrient intake level estimated to meet the requirements of half the healthy individuals in a particular life stage and gender group, is primarily used to evaluate the dietary intake of populations or groups. An AI is used when an EAR cannot be established. The AI is the average nutrient level consumed daily by a typical healthy population that is assumed to be adequate for the population’s needs. Thereafter, for each nutrient, participants were classified into four groups based on their level of intake: <50% EAR (severely low intake), 50-75% EAR(moderately low intake), 75-100% EAR (mildly low or sufficient intake) and >100% EAR (optimum intake).
Statistical Analysis
Statistical analysis was carried out using SPSS version 25 for Windows (IBM Corporation, United States, 2017). The data were presented as frequency (percentage), Mean± standard deviation (SD; for normally distributed data), or Median (25th – 75th quartile; when data was not normally distributed). The differences in dietary data and anthropometry, categorized by gender or diet type, were assessed using the Independent Sample T-test or Mann-Whitney U test. Furthermore, differences in food frequency intake were evaluated using the Mann-Whitney U test, based on gender or diet type classification. For categorical variables, cross-tabulations were generated according to gender or diet type, and their comparison was conducted using the chi-square test. P ≤ 0.05 was considered statistically significant.
Results
Data was collected on 220 participants. However, 6 participants provided incomplete data and hence final data was analysed in 214 participants, comprising 69 females and 145 males (Figure 1). Among them, 60 individuals followed a vegetarian diet (including dairy), while 154 were non-vegetarians who reported consuming eggs and meat at least 1-2 times per week. The mean age for females was 33± 5.8 years, while the mean age for males averaged 34.6± 6 years.
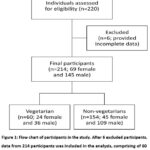 |
Figure 1: Flow chart of participants in the study. After 6 excluded participants, data from 214 study participants. |
Prevalence of malnutrition
Obesity is defined as a paradoxical state of malnutrition, as this nutritional imbalance negatively alters the micronutrient status of individuals.20 The average weight for men was 77.2 ± 13.5 kg and for women 67.5 ± 15.9 kg, considerably higher than the reference weight of 65 kg and 55 kg for men and women, respectively, used to calculate the EAR.
We evaluated the Body Mass Index (BMI), a widely accepted measure of obesity, among 214 participants. The findings revealed a spectrum of BMI classifications: 3.8% of participants were categorized as underweight, 16.7% had normal weight, 20% as overweight, and a significant 59.6% were classified as obese. Grade-1 obesity was the predominant category, encompassing 41.0% of participants, with Grade-2 obesity following at 18.6% (see Figure 2). These results underscored the prevalence of obesity within our participant group, indicating the potential health risks associated with this condition.
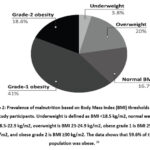 |
Figure 2: Prevalence of malnutrition based on Body Mass Index (BMI) thresholds in the 214 study participants. |
We also evaluated the body composition of a subset of the participants (n = 77; Table 1). Females weighed significantly lesser as compared to males (p≤ 0.05). Females had significantly higher body fat percentage as compared to males (p≤ 0.001), whereas males had significantly higher skeletal muscle mass as compared to females (p≤ 0.001). There was no significant difference in visceral fat between the groups.
Table 1: Anthropometry and body composition of a subset of participants (n=77) when classified according to gender. Statistically significant differences between the groups (Student’s t-test) are indicated with * (p ≤ .05) and ** (p ≤ .001).
|
|
Females (n=21) | Males (n=56) |
|
Age (years) |
32.6 ± 8.5 | 35 ± 7 |
| Weight (kg)* | 65.9 ± 17.9 |
76.1 ± 12.7 |
|
BMI (kg/m2) |
25.9 ± 5.4 |
25.9 ± 3.6 |
| Body fat (%)**
Normal: < 25% in men < 30% in women |
36.6 ± 5.6 |
27 ± 6 |
|
Visceral fat (%) Normal: 0.5-9.5 |
8.9 ± 6.1 |
11 ± 4.2 |
|
Skeletal muscle mass (%)** Normal: Men: 32.9-35.7 Women: 25.9-27.9 |
24.5 ± 3.3 |
30.6 ± 3 |
Energy and macronutrient intake of the participants
Participants were consuming on average 4±1 meals in a day. The study revealed that participants’ diets had lower total energy and carbohydrate intake but higher protein and fat intake in comparison to ICMR-NIN recommendations of EAR, as shown by the NAR.
Non-vegetarians consumed mostly chicken, eggs and fish, 2-3 times per week. Although a significant increase was observed in their protein intake compared to vegetarians, non-vegetarians did not report regular consumption of meat and meat products. In addition, non-vegetarians exhibited notably higher fat intake, energy derived from proteins, energy from fats, and NAR for protein compared to vegetarians (p<0.05; Table 2). In contrast, vegetarians had significantly higher energy intake from carbohydrates compared to non-vegetarians (p<0.05), as has been shown previously by a higher intake of cereal.22 EPA and DHA intake was not present in the vegetarian diet.
There were no significant differences in fibre intake between vegetarians and non-vegetarians (Table 1). The intake of insoluble fibre was significantly higher than soluble fibre in the entire population (p<0.001). Overall, dietary fibre intake was found to be satisfactory among the participants as the NAR was >90% (Table 2).
Table 2: Dietary intake of macronutrients analyzed for the 214 participants, and for the vegetarian and non-vegetarian categories. Normally distributed values depicted as means ± standard deviation (SD), whereas non-normally distributed values are shown as Medians [25th – 75th quartile]. The Nutrient Adequacy Ratio (NAR) was calculated as per ICMR-NIN guidelines (2020).23 Statistical significance (Student’s t-test) is indicated with * (p ≤ .05) and ** (p ≤ .001).
|
Daily Energy and Macronutrient Intake |
Vegetarians (n=60)
Mean ± SD |
Non-vegetarians (n=154)
Mean ± SD |
Total (n=214) Mean ± SD |
|
Energy (kcal) |
1572 ± 557 | 1742.9 ± 646 | 1695 ± 626 |
| Carbohydrates (g) | 197 ± 73 | 205 ± 82.1 |
202.8 ± 79.6 |
|
Total fibre (g) |
26.3 ± 12.4 | 25.9 ± 12 | 26 ± 12.1 |
| Soluble fibre (g) | 5.2 ± 3.2 | 5.4 ± 2.9 |
5.3 ± 3 |
|
Insoluble fibre (g) |
19.6 ± 12.8 | 18.7 ± 9.7 | 19 ± 10.7 |
| Proteins (g) | 47.7 ± 18.1 | 57.3 ± 23.2 * |
54.6 ± 22.3 |
|
Fats (g) |
64.8 ± 26.9 | 75.7 ± 31.8 * | 72.6 ± 30.9 |
| ALA (mg) $ [range] | 82.9
[74.7-106.6] |
86.8
[66.3-119.3] |
85 [67.3-115.7] |
|
EPA (mg) $ [range] |
0 | 10.6
[1.3-50] |
4.7 [0-22.1] |
|
DHA (mg) $ [range] |
0 | 19.1
[0.3-136.5] |
8.5 [0-40] |
|
Total omega-3 fats (mg) |
329.5 ± 183.3 | 322.1 ± 167.9 | 324.2 ± 171.9 |
| Energy from carbohydrates (%) | 50.5 ± 6.2 * | 47±7.8 |
48 ± 7.5 |
|
Energy from protein (%) |
12.3 ± 2.9 | 13.4 ± 3.6 * | 13.1 ± 3.5 |
| Energy from fats (%) | 36.7 ± 6.4 | 39.1 ± 7.6 * |
38.4 ± 7.3 |
|
Energy from Omega-3 fats (kcal) |
3 ± 2 | 3 ± 2 | 3 ± 2 |
| NAR energy (%) | 82.5 ± 30.6 | 88.2 ± 31.2 |
86.6 ± 31.1 |
|
NAR fibre (%) |
94.2 ± 43.2 | 90.6 ± 40.3 | 91.6 ± 41.1 |
| NAR proteins (%) | 119.6 ± 47.3 | 140 ± 56 * |
134.3 ± 54.4 |
$ Data presented as Median [25th – 75th quartile]
Male participants exhibited significantly higher energy and carbohydrate intake, while both genders had a higher energy contribution from dietary fat and a lower contribution from carbohydrates than recommended by the ICMR-NIN. Notably, males showed a significantly higher energy intake from carbohydrates compared to females (data not shown). Despite lower dietary fat intake among females, the energy contribution from fat to their total energy intake was significantly higher than in males.
Micronutrient intake of the participants
Non-vegetarian participants exhibited significantly higher intake of niacin, vitamin B12, pyridoxine, as well as NAR for niacin, pyridoxine, and vitamin B12, in comparison to their vegetarian counterparts (Supplementary Table 4). Additionally, non-vegetarian males displayed significantly higher intake of thiamine, vitamin D2, and NAR for thiamine compared to vegetarian males (Supplementary Table 4).
Table 3: Micronutrient intake in the population compared to Estimated Average Requirements (EAR), presented as a percentage of the 214 study participants. An intake of <50% of EAR was considered as severely low, 50-75% of EAR as moderately low, and 75-100% of EAR as mildly low or sufficient intake and >100% EAR as optimum intake.
|
Energy and Nutrients |
Micronutrient intake
(% of participants) |
|||
| <50% EAR | 50-75% EAR | 75-100% EAR |
>100% EAR |
|
|
Energy |
9.8 | 28 | 31.8 | 30.4 |
| Protein | 0.9 | 11.2 | 16.8 |
71 |
|
Fibre |
10.7 | 29.9 | 28 | 31.3 |
| Calcium | 42.5 | 36.4 | 11.7 |
9.3 |
|
Phosphorus |
6.5 | 18.7 | 29 | 45.8 |
| Iron | 13.3 | 25.7 | 24.3 |
36.7 |
|
Sodium ^ |
3.3 | 7.5 | 15.4 | 73.8 |
| Potassium | 55.1 | 27.1 | 12.6 |
5.1 |
|
Zinc |
63.1 | 26.6 | 7.9 | 2.3 |
| Magnesium | 15.9 | 38.8 | 19.6 |
25.7 |
|
Copper |
26.3 | 31.5 | 12.7 | 29.6 |
| Iodine | 30.8 | 13.1 | 21 |
35 |
|
Vitamin C |
21.9 | 22.9 | 18.4 | 36.8 |
| Thiamine | 44.8 | 34.4 | 14.6 |
6.1 |
|
Riboflavin |
94.9 | 4.7 | 0.5 | 0 |
|
Niacin ^ |
26.4 | 21.7 | 22.2 |
29.7 |
| Pyridoxine ^ | 29 | 24.8 | 15.9 |
30.4 |
|
Folate |
75.8 | 13.1 | 5.6 | 5.6 |
| Vitamin B12 | 89.3 | 3.7 | 3.7 |
3.3 |
|
Vitamin A |
51.4 | 19.3 | 5.7 |
23.6 |
^ Significantly higher in non-vegetarians
Non-vegetarians consumed significantly more sodium (Supplementary Table 4). There was a significant difference between the prevalence of low iron intake when compared on the basis of gender. 29% of women had severely low intake (<50% EAR) as compared to men (5.7%; data not shown).
Frequency of foods
The following observations were derived from the frequency of foods consumed by the participants (in %) as shown in Supplementary Tables and Supplementary Figures:
84.1% and 71.9% consumed wheat and rice (and their preparations), respectively, on a daily basis. Only 5.1% consumed millets and 5.1% consumed oats daily. (Supplementary Table 2)
51.8% consumed split lentils daily, whereas 8.4% consumed whole pulses daily. 0.5% consumed soy products daily. (Supplementary Table 2)
49.4% consumed cow or buffalo milk daily, while 11.2% consumed yogurt and 0.5% consumed paneer. (Supplementary Table 2)
2% consumed chicken, fish and mutton, while 14.9% consumed eggs daily (egg white/whole). (Supplementary Table 2)
14.5% consumed walnuts, 2.8% flax seeds and 1.9% consumed chia seeds daily (sources of omega-3 fats). 30% consumed almonds, while other nuts were barely consumed.
60% consumed 1-3 cups tea per day, while 28% had 1-3 cups of coffee per day (Supplementary Table 3).
In addition to potatoes, onions, coriander and cucumber, other vegetables were barely consumed daily (<2.3% of the population; Supplementary Figure 1).
Other than tomato, apple and banana, other fruits were mostly rarely consumed (Supplementary Figure 2).
Nutritional supplements intake
Very few participants (total 17.3%; 38 participants) consumed nutritional supplements, as shown in Table 4.
Table 4: 38 of the 214 participants were consuming nutritional supplements. They were organised into the categories of nutrients provided.
|
Supplement category |
Proportion of participants (%) |
|
Multivitamin and minerals |
9.1 |
| Single vitamins (vitamin C, E or D) |
7.3 |
|
Calcium |
1.4 |
| Iron |
0.9 |
|
Omega-3 fats or fish oil |
3.2 |
| Whey or other protein |
7.3 |
|
Herbal/Ayurvedic supplement |
2.3 |
Discussion
An imbalance in macronutrient and micronutrient intake are key drivers for the dual undernutrition-obesity problem we face today. Carbohydrate consumption constitutes the bulk of the total calorie intake. Wheat is the staple of North Indians, while those in South India favour rice. In the past few decades, a declining trend of cereal intake has been noted, alongside a shift towards more energy-dense foods, indicating a fat-rich diet.24
In our study, carbohydrate and overall energy intake was shown to be lower than the established EAR (Table 2). Yet, this population showed a high prevalence of obesity, as shown by their BMI, calculated from self-reported weight and height. A subset of this group that provided body composition data, showed low muscle mass and high visceral and overall body fat (Table 1), both significant risk factors for NCDs. A study reported an incidence of 44.27% of obesity in urban, Western India (Maharashtra, Gujarat and Rajasthan), whereas our study indicates a much higher prevalence (59.6%).25 One major reason for this is the high fat intake, an energy-dense nutrient, which was seen especially in women. Limited physical activity is also a cause for obesity in a population of working professionals. Furthermore, there are other dietary factors playing into this paradox, as discussed below.
Protein intake
Previous data from surveys have shown poor protein intake in India.26 This can be due to the low intake of non-vegetarian food in the country, caused not only by socioeconomic factors, but also due to vegetarianism being promoted as a superior way of life. An interesting observation in the study was that even those who claim to be non-vegetarian, have very similar eating patterns to vegetarians, as shown by a similar macronutrient intake (a difference of about 10g protein). Only 55% of the non-vegetarians in this study (39.7% of the total population) consumed non-vegetarian food in 3 or 4 meals per week. Interestingly, 72% of the participants were non-vegetarians, and 71% of participants reached protein sufficiency (Table 2). We were unable to determine whether they were the same participants.
Our study showed that protein intake was sufficient in the population. One explanation for this discrepancy is the low requirement values, revised in 2020 by ICMR-NIN. The EAR suggests a sufficiency of 0.66 g/kg body weight, a mere 43g for men and 36g for women (Supplementary Table 1), assuming the body weight of 65 kg for men and 55 kg for women. This population had a much higher body weight of 77.2 kg for men and 67.5 kg for women. Global standards suggest 0.8 to 1 g of protein per kg body weight and higher. Upon comparing our protein intake with the recommended dietary allowance (RDA) of 0.83 g per kg body weight, it was found that only 49.1 % of the population was achieving it. The EAR being a lower requirement was easy to surpass. The existing framework for determining protein requirements confines protein’s role to its physiological needs and preserving nitrogen balance. However, a growing body of evidence suggests that protein, and its quality, can offer functional advantages beyond merely maintaining nitrogen balance. For instance, protein plays a significant role in controlling glycemic levels and appetite, indicating its broader impact on overall health and well-being.27
Overreporting or overestimation is an issue with protein intake from diet recall studies.28 This is especially possible, with the low intake of non-vegetarian foods in this population, where the main source of protein is cereal and pulses. The predominant cereal-based diet, evident in the FFQ, has been reported in earlier studies.27 The consumption of pulses is lower than that of cereal. Pulses provide lysine, the most limiting amino acid in cereal proteins. Therefore, lysine intake is generally low in the Indian diet.29 As shown by the FFQ, split lentils [‘dal’], are being consumed only 2-3 times per week on average, and about half of the population consumes it on a daily basis. Dal is normally watered down whilst cooking, a common practice amongst many Indian communities, thereby reducing the quantity consumed. The intake of other pulses (including preparations like tofu) is fortnightly or once a month. Lysine plays a key role in muscle protein synthesis, and coupled with a sedentary lifestyle, Indians exhibit low lean muscle mass.30 Here too, the muscle mass of the population was reported to be low, an indicator of poor metabolic health and a strong predictor of all-cause mortality.31
Fibre intake
The AI of dietary fibre in India is 25-30 g/day for a sedentary individual, without a recommended split in soluble and insoluble fibre.23 In this study, fibre intake was sufficient (Table 2), with >90% of participants meeting the AI. However, insoluble fibre was almost four-fold greater than the amount of soluble fibre, the latter being a prebiotic, which can promote the growth of beneficial gut microbes. This finding is in line with the high intake of cereal, our main source of insoluble fibre, and the low intake of fruit and vegetables (F&V), nuts, and seeds. Insoluble fibre is very beneficial for fecal bulking and promoting regularity, but most of the other benefits of dietary fibre can be ascribed to soluble fibre. Other than their essential role in intestinal motility, soluble fibre is known to improve overall intestinal health, improve our lipid profile, reduce glycaemic response, and promote meal satiety.32 For example, a study that compared meals containing cornflakes and milk with or without fruits and nuts, revealed that the latter had a lower glycaemic index and higher satiety levels in healthy men.33 Epidemiological studies have corroborated this by correlating high consumption of dietary fibre with lower incidence of NCDs.32
Daily consumption of tomatoes and onions was 50-60% as they are used as a base for Indian cooking (Supplementary Figure 1 and 2). For all other fruits, the percentage of participants consuming any fruit daily was a mere 11.2%. Barring potatoes, the percentage of participants consuming any vegetable daily was a paltry 13%. This suggests low F&V intake in participants of the study, which has been reflected in the poor intake of soluble fibre and potassium (Table 3; discussed later). A previous study reported that energy from F&V is a mere 2.6% compared to the recommended 10%, and 11% energy is contributed from chips, biscuits and sweets.34 According to the National Non-Communicable Diseases Monitoring Survey in India 2021, 97.7% of the studied population had inadequate consumption of F&V (<5 servings/day).35
Antioxidant and Omega-3 fat intake
Chronic or sustained inflammation increases oxidative stress and disrupts autophagy 36, a recycling mechanism that maintains cellular proteostasis. Together, they can contribute to the development and progression of NCDs.37 Increases in NCDs may be attributed to the low intake of fibre, antioxidants and omega-3 fats from F&V, seeds and nuts. An inverse correlation in all-cause mortality has been noted in many populations with increased intake of nuts and seeds, and F&V.38 Most notable were some studies showing a robust dose-response relationship up to 7+ servings/day for F&V combined,39 higher than the recommended 5 servings/day (or 400 g/day) as suggested by the WHO and other global organisations.40 While energy-dense, nuts and seeds are nutrient-dense, and a good source of healthy fats like omega-3s and monounsaturated fatty acids.41,42
Omega-3 fats, specifically the long-chain omega-3 fats, eicosapentaenoic acid (EPA) and docosahexaenoic acid (DHA), and phytonutrients (like carotenoids) have strong anti-inflammatory and antioxidant properties. Meta-analyses indicated that these nutrients play a crucial role in the prevention of NCDs.43,44
The energy derived from omega-3 fats in all the participants (3 kcal per day; Table 2) is far lower than ICMR-NIN recommendations (0.5-2% of total energy). Furthermore, based on the dietary patterns of the participants, omega-3 fats are derived from vegetarian sources, in the form of α-linolenic acid (ALA). Unfortunately, the conversion of ALA to its longer chain forms, EPA and DHA, is poor in the body due to the limiting desaturase enzyme shared by dietary omega-6 fats consumed in large amounts through cooking oils. This assumption of the modern diet applies to the Indian population as the ratio of omega-6: omega-3 in urban India ranges from 38:1 to 50:1, considerably more than the ideal 3:1.45 This ratio is of significance to guide not only the quantity of fats being consumed, but the quality as well.
Carotenoids are strong antioxidants and their daily consumption has the potential for reducing the risk of many chronic and degenerative diseases contributed to by oxidative stress. Their dietary intake has been correlated with a reduced incidence of NCDs, including type 2 diabetes, CVD and intestinal and prostate cancer.46 The main carotenoids in our diet are β-carotene, followed by lycopene. Being a non-provitamin A carotenoid, lycopene has been used in many studies that suggested its benefits in ameliorating cancer insurgences, cardiac complications, diabetes, inflammatory events, skin and bone diseases, as well as neural, hepatic and reproductive disorders.47 Many micronutrients like vitamin C, vitamin E and zinc (discussed later) also have antioxidant properties, and have clear ICMR-NIN recommendations. For phytonutrients like non-vitamin A carotenoids, no intake recommendations are currently proposed. However, existing recommendations for increased consumption of carotenoid-rich F&Vs are sufficiently supported.48
Sugar intake
Coffee and tea are among the most widely consumed beverages worldwide, especially in the workplace. Due to the polyphenols present in them, their normal consumption has shown positive health outcomes. Tea and coffee intake in this Mumbai population (Supplementary Table 3), however, may have a negative impact due to the high amount of sugar used in their preparation, typically about 5-7g sugar per cup.49 While, we were unable to acquire direct sugar intake, sugar consumption was deduced from foods and beverage frequency. The consensus dietary guidelines for Indians in 2011 recommend <10% of total calories from free sugars per day50 similar to WHO recommendations, which also mentions a reduction to <5% for additional health benefits. 51
A 2014 report showed that India is the largest consumer of sugar in the world, not including the use of traditional sweeteners like jaggery 50, which is perhaps contributing to the rise in obesity and other metabolic disorders. A national survey (by NIN) investigating sugar intake showed about 26.3 g/day in Mumbai, where the literate population consumed 15.6 g/day.49 Assuming 5-7g sugar per cup, this is consistent with our study showing 15% of the population consuming 3 or more cups of tea per day and 22.5% consuming at least 2 cups of tea. However, according to The European Food Safety Authority (EFSA), the risk of dental caries or chronic metabolic diseases increases with any dose of sugar intake (from available data). Therefore, the intake of added sugar should be as low as possible.52
Micronutrient intake
Food intake patterns showed that most Indians are predominantly vegetarians and that food items rich in micronutrients (pulses, other vegetables, fruits, nuts, oilseeds and animal foods) are generally consumed less frequently.27,53 In terms of cereal intake, which is the predominant energy contributor, mostly white rice and wheat rotis are consumed, with little millet intake. This is also apparent from the high phosphorous intake (45% of participants >100% EAR), the main source of which is cereal grains. The various health benefits of millets have been previously reviewed54 as they are high in various micronutrients and fibre, with a low glycaemic index, and thus can be used in the management of diabetes.55 Despite their nutritional benefits on various NCDs, millets are being underutilized, as shown herein.54There is a worldwide initiative (by the Food and Agriculture Organization; FAO) to increase millet consumption.56 Given the high intake of polished rice and wheat, a very low intake of micronutrients has been reported in this analysis. Micronutrient content has been reported to be lower in polished grains.57
Vitamins
A major public health concern in India is apparent when an alarming 51.4% of participants showed <50% EAR of vitamin A (Table 3). There have been government initiatives for vitamin A supplementation for over four decades to prevent its deficiency. It is required for normal growth and development, maintenance of healthy mucosal membranes, reproductive and immune health, and vision.58 Studies have shown that the main sources of vitamin A is via conversion of β-carotene obtained from green leafy vegetables, consumption of which was low in the study participants. Preformed vitamin A, as well as niacin, vitamin B6 and B12 are acquired from meat and eggs, which are low even in the diet of non-vegetarians. In fact, 89.3% participants had <50% EAR of vitamin B12. This calculated value would not account for the age or genetically-induced poor bioavailability of vitamin B12 in many Indians caused by low production of intrinsic factor required for its absorption.59 Furthermore, long-term use of antacid drugs like proton-pump inhibitors and H2-receptor antagonists, and the antidiabetes drug, metformin, are associated with increased risk of B12 deficiency.60 The use of these drugs is growing significantly due to the rising incidence of gastroesophageal reflux disease and diabetes.6
The low intake of nutrition-dense foods like F&V also lead to low levels of antioxidants like vitamin C, and to lower intake of B-complex vitamins (Table 3). B-vitamin deficiencies are rampant in India, particularly alarming for vitamin B12 and folic acid, even in apparently healthy individuals.61,62 Low levels of thiamine, niacin and pyridoxine, and extremely low intake levels of vitamin B12, folate, and riboflavin were seen in this population. Some of these B-vitamin insufficiencies can lead to anemia and are known to cause an increase in homocysteine, a marker for inflammation. 63,64
One particularly alarming result was that of riboflavin, where 94.9% of participants had <50% its EAR, affecting both genders and across dietary behaviours (Table 3). One reason is because its main sources are meat, dairy, nuts and green leafy vegetables, which were all reported to be scarce in this group. Another reason is the polishing and milling of wheat and rice, which may result in the loss of the vitamin. The Indian diet obtains riboflavin mainly from these sources, which are mostly consumed in their polished form. Its modern-day nature is perhaps the reason why riboflavin deficiency receives little attention, even though it has been reported previously.61,65,66
With regard to B-complex vitamins, there were some expected differences in vegetarians and non-vegetarians. More niacin, pyridoxine and vitamin B12 was consumed by non-vegetarians, despite the higher intake of milk products amongst vegetarians. Some gender-based differences were also noteworthy. Men had a higher NAR of niacin, riboflavin, thiamine, and vitamin D, which was likely due to a higher intake of food. Non-vegetarian females had a higher NAR niacin than non-vegetarian males and the same for vegetarians. Non-vegetarian females also had higher lycopene intake over non-vegetarian males. The reasons for these results could not be explained from previous data.
Minerals
Following the trend, low mineral intake was not a surprising result (Table 3). 63.1% had <50% EAR zinc, an essential component of more than 1000 enzymatic reactions and over 2000 transcription factors that are needed for the regulation of lipid, protein and nucleic acid metabolism.67 Poor bioavailability of zinc is the biggest cause of its deficiency. 68 However, this data suggests that poor zinc supply may be compounding the issue.
Another important component of hundreds of proteins supporting essential biological functions is iron, the most common deficiency globally.69 64% of participants did not meet 100% of its EAR, and its severely low intake (<50% NAR) was reported to be significantly higher in women (29%) as compared to men (5.7%). This may be due to the high intake of vegetarian food. The requirement of iron for women is also higher than that of men (EAR of 15 mg/day vs 11 mg/day). With similar food intake to other groups, poor bioavailability of non-heme iron further heightens the problem for vegetarian women. The National Family Health Survey (NFHS-5) supports our results, where women were found to have a comparatively higher prevalence of anemia than men.70
The opposing effects of sodium and potassium help maintain physiological balance. The sodium/potassium ratio is a predictor for cardiovascular events. Studies indicate that high potassium intake can mitigate the risk of high blood pressure despite high-sodium in diets that are prevalent today.35 Similarly, in this study, sodium intake was 60% higher than the EAR. Due to the higher sodium content in non-vegetarian foods, NAR sodium was higher in non-vegetarians as compared to vegetarians. 55.1% had <50% EAR potassium, which is mostly acquired from F&V. Here, the participants achieved only half of the potassium EAR of 3500 mg. Although a daily intake of 4700 mg of potassium intake has been identified as a priority intervention to reduce NCDs, there are very few programmes for increasing potassium intake at the population level.71,72,73,74 Owing to the risk of iodine deficiency, increasing potassium may be a better strategy to mitigate cardiovascular disease risk than restricting iodised salt.35
The Indian population faces a risk of iodine deficiency disorders (IDDs) because of the insufficient iodine content in the soil, affecting both animal and plant-based foods. Universal Salt Iodization (USI) has been acknowledged as a crucial approach for mitigating IDD within the country.75 A 2014-15 National Iodine and Salt Intake (NISI) survey showed that 78% of households in India are consuming adequately iodized salt; the remaining suffer from lack of access to adequately iodised salt.75,76 Access is not an issue for this population, and their iodine intake was calculated to be sufficient. However, about 40% of iodine is lost upon cooking,23,77 and this deficit might be subclinical. There is also a rise of non-iodised salt substitutes, like Himalayan pink salt and sea salt, often marketed in India as healthier alternatives. Given iodine’s crucial role in the production of thyroid hormones, the iodine status must be biochemically determined.
Calcium and magnesium both, have structural and functional roles in the body, and are required in much higher concentrations than other minerals. Besides low intake of vitamin D, low calcium intake may be responsible for the high prevalence of osteopenia and osteoporosis in India, especially in women.23 Its main source in our diet, cow’s milk, was consumed daily by only 35% of participants and 12.1% of participants consumed buffalo’s milk daily. Consequently, the NAR of calcium was only 58% here, with only 9.3% of participants meeting the EAR of calcium (800 mg) (Table 3).
The investigation of magnesium deficiency in India is scarce.78 Magnesium intake was moderately low in this population, as consumption of its sources including green leafy vegetables, unpolished grains, and nuts was also low. A high supplemental intake of calcium and vitamin D, common practices due to the high prevalence of their deficiencies and of osteopenia, also deplete magnesium levels.79,80 In fact, low magnesium intakes coupled with high calcium intakes (high Ca: Mg; >2.6:1)80 have been associated with elevated levels of inflammation and an increased risk for chronic conditions such as cardiovascular disease.80 Given that the modern diet is low in magnesium, its poor bioavailability78, and the average body weight of individuals is higher, experts believe that the recommended intake of magnesium is very conservative. The degree of magnesium deficit and its adverse impacts may be grossly underestimated. Adequate intake has been associated with lower diabetes, hypertension, and CVD risk.81 Diet surveys from most industrialized countries show a suboptimal intake of magnesium, and thus insufficiencies may be more common in India than is believed.82,78
Nutritional supplement intake
EARs are lower than RDAs, and a large percentage of the study population did not meet the EAR. Supplement use was also very low in the population (only about 17.3%; Table 4), with some using traditional herbal supplements with unknown levels of nutrients. Literature suggests a beneficial role of micronutrient supplements with incidence and management of not only NCDs, but also infections like COVID-19.83 Low intake of nutrition supplements may reflect the low awareness of participants toward nutritional requirements. While these nutritional inadequacies seem rather severe, the real picture is likely more grim as these are calculated values from food intake. These do not account for bioavailability of nutrients or the losses of nutrients due to cooking and storage methods. For example, B-vitamins and vitamin C are degraded with heat and even light.84 One study reported that up to 60% of B-vitamins can be lost when boiling foods and discarding the water.85 Other lifestyle factors, like smoking or alcohol consumption, that deplete nutrient stores and reduce bioavailability, could not be acquired from the participants, as they were not prepared or required to disclose these details.
Study limitations and future directions
Nutrient intake can help predict, but not assess nutritional status. Therefore, the biggest limitation of the study was our inability to acquire biochemical data of the study population. The purposive sampling technique of recruitment caused the disproportionate gender distribution. The discerning nature of participants in the study cannot be controlled for, often leading to underreporting or overreporting of dietary behaviour. Poor recall may also be an issue with this study design. Finally, many of the participants, who do not prepare their own food, may be severely unaware of the ingredients and quantities used, especially with cooking oils. Women reported a higher diversity in food intake as compared to men (data not shown). However, this analysis has several strengths. Two days of analysis, one weekday and one weekend day, were included in the 24-hour recall to adjust for differing eating patterns. A representative sample of the population was acquired, with a varied mix of communities. These findings can therefore be extrapolated for other urban dwellers in this demographic. While recent reports are limited, the data align with their findings. This study exclusively included Indian professionals, who lead a busy lifestyle, but have the access and purchasing power to eat better. Given that there may be a variation in nutritional education and availability in different regions, more cities in India can be included in future studies, with a closer investigation of cooking methods. Larger, country-wide studies can be used to corroborate these data, alongside biochemical testing, which provide information to corporations to implement better eating programmes in this post-COVID19 era.
Conclusion
Nutrition plays a pivotal role in promoting health across all demographics, regardless of gender or age. Diets lacking diversity and nutritional quality—characterized by low F&V intake and high levels of salt, sugar, and fat—contribute to India’s growing disease burden.86 The current study underscores that educational and socioeconomic status may not necessarily reflect the level of nutritional awareness. This study provided information on the prevalence of specific micronutrient intake deficits in 30-40 year-old working professionals, which can be addressed prior to the escalation of NCDs in this age group. As described above, micronutrient intake was very low among study participants, and there was an imbalance of macronutrient intake, due to less variability in the diet. The low intake of omega-3 fats, Vitamins A, B12, folate and riboflavin, zinc, potassium, and overall fruit and vegetables was particularly alarming. Consequently, there is a pressing need to educate corporate employees about the repercussions of consuming unbalanced diets and to address their nutritional requirements, particularly in cases of deficiencies, and the specific NCD risks caused due to their sedentary occupation. They can also be informed about the far-reaching benefits of a balanced diet. This study provides preliminary data on dietary behaviour and nutritional intake on this demographic, which is largely unexplored. It provides the basis to plan nutrition awareness programmes for working professionals with the foods they have access to. Education on the use of fortified food items and organizing nutritional and health awareness programmes can serve as a means to inspire participants to adopt healthier dietary practices and embrace dietary diversity.
Acknowledgement
We would like to acknowledge that Fashutana Patel designed the figures and Rheah Mehta helped in copy editing the manuscript. We would like to thank PINC for allowing us to conduct data collection in their organization. We would like to acknowledge all the nutritionists (Tasneem Ravat, Arwa Ujjainwala, Dishani Mehta, Simran Pathan, Salma Khokar, Tanisha Sanghavi, Bansari Rao, Farida Gohil Mandsaurwala, Afreen Khan, Kavya Sawant, Pooja Udeshi, Prachi Sawtekar, Reshma Joshi, Rucha Mhatre) involved in the data collection process. We would also like to thank all the subjects who participated in the study.
Funding source
The project was sponsored by Axys Nutrition Products Pvt. Ltd., Mumbai, India.
Conflict of interest
The authors declare that there are no conflicts of interest.
Data Availability Statement
The authors confirm that the data supporting the findings of this study are available in the article and its supplementary material. Raw data that support the findings of this study are available from the corresponding author.
Ethics Statement
Ethical approval was obtained from an independent ethics committee, Bay View Clinic (MCGB Reg. No. 887302745).
Informed Consent Statement
Informed consent was obtained for the study and it conforms to the standards currently applied in the country of origin. Participation in the study was voluntary.
Authors’ Contribution
AP, MSM, KVD and NSK conceptualized the project and planned the study. SM and AM, the principal investigators, designed and executed the data collection and data entry process by guiding all the clinical nutritionists. NS performed all the statistical analysis tests, and data interpretation was carried out by SM, SM and NS. MSM, KVD and NSK were involved in writing the manuscript. MSM had primary responsibility for the final content. All authors read and approved the final manuscript.
References
- Fact sheets – Malnutrition. Accessed December 13, 2023. https://www.who.int/news-room/fact-sheets/detail/malnutrition
- Kobylińska M, Antosik K, Decyk A, Kurowska K. Malnutrition in Obesity: Is It Possible? Obes Facts. 2022;15(1):19. doi:10.1159/000519503
CrossRef - Dutta M, Selvamani Y, Singh P, Prashad L. The double burden of malnutrition among adults in India: evidence from the National Family Health Survey-4 (2015-16). Epidemiol Health. 2019;41. doi:10.4178/EPIH.E2019050
CrossRef - Pingali P, Aiyar A, Abraham M, Rahman A. The Nutrition Transformation: From Undernutrition to Obesity. Published online 2019:93-133. doi:10.1007/978-3-030-14409-8_5
CrossRef - Menon GR, Yadav J, John D. Burden of non-communicable diseases and its associated economic costs in India. Social Sciences & Humanities Open. 2022;5(1):100256. doi:10.1016/J.SSAHO.2022.100256
CrossRef - Anjana RM, Unnikrishnan R, Deepa M, et al. Metabolic non-communicable disease health report of India: the ICMR-INDIAB national cross-sectional study (ICMR-INDIAB-17). Lancet Diabetes Endocrinol. 2023;11(7):474-489. doi:10.1016/S2213-8587(23)00119-5
CrossRef - Nediani C, Giovannelli L. Oxidative Stress and Inflammation as Targets for Novel Preventive and Therapeutic Approches in Non Communicable Diseases. Antioxidants 2020, Vol 9, Page 290. 2020;9(4):290. doi:10.3390/ANTIOX9040290
CrossRef - Sunitha S, Gururaj G. Health behaviours & problems among young people in India: Cause for concern & call for action. Indian J Med Res. 2014;140(2):185. Accessed December 14, 2023. /pmc/articles/PMC4216492/
- GOQii “India Fit” 2017 reveals alarming facts – GOQii. Accessed December 14, 2023. https://goqii.com/blog/goqii-india-fit-2017-reveals-alarming-facts/
- Meenakshi J V. TRENDS AND PATTERNS IN THE TRIPLE BURDEN OF MALNUTRITION IN INDIA. Published online 2016. Accessed November 23, 2023. http://www.cdedse.org/working-paper-frameset.htm
- Echouffo-Tcheugui JB, Ahima RS. Does diet quality or nutrient quantity contribute more to health? J Clin Invest. 2019;129(10):3969. doi:10.1172/JCI131449
CrossRef - Rodriguez‐leyva D, Pierce GN. The Impact of Nutrition on the COVID-19 Pandemic and the Impact of the COVID-19 Pandemic on Nutrition. Nutrients. 2021;13(6). doi:10.3390/NU13061752
CrossRef - Venkatesh U, Sharma A, Ananthan VA, Subbiah P, Durga R. Micronutrient’s deficiency in India: a systematic review and meta-analysis. J Nutr Sci. 2021;10(11). doi:10.1017/JNS.2021.102
CrossRef - Bangale N, Mahesh M, Sudagani J, et al. Demystifying the micronutrient deficiency burden in India. IP Journal of Nutrition, Metabolism and Health Science. 2022;5(3):91-99. doi:10.18231/J.IJNMHS.2022.017
CrossRef - Cui Q, Xia Y, Wu Q, Chang Q, Niu K, Zhao Y. Validity of the food frequency questionnaire for adults in nutritional epidemiological studies: A systematic review and meta-analysis. Crit Rev Food Sci Nutr. 2023;63(12):1670-1688. doi:10.1080/10408398.2021.1966737
CrossRef - T. Longvah, R. Ananthan, K. Bhaskarachary, K. Venkaiah. Indian Food Composition Table. National Institute of Nutrition (Indian Council of Medical Research); 2017
- Gostas DE, Larson-Meyer DE, Yoder HA, Huffman AE, Johnson EC. Dietary Relationship with 24 h Urinary Iodine Concentrations of Young Adults in the Mountain West Region of the United States. Nutrients. 2020;12(1). doi:10.3390/NU12010121
CrossRef - Longvah T, Deosthale YG. Iodine content of commonly consumed foods and water from the goitre-endemic northeast region of India. Food Chem. 1998;61(3):327-331. doi:10.1016/S0308-8146(97)00065-4
CrossRef - A study of calcium intake and sources of calcium in adolescent boys and girls from two socioeconomic strata, in Pune, India – PubMed. Accessed December 14, 2023. https://pubmed.ncbi.nlm.nih.gov/20805075/
- Kobylińska M, Antosik K, Decyk A, Kurowska K. Malnutrition in Obesity: Is It Possible? Obes Facts. 2022;15(1):19. doi:10.1159/000519503
CrossRef - Aziz N, Kallur SD, Nirmalan P. Implications of the Revised Consensus Body Mass Indices for Asian Indians on Clinical Obstetric Practice. J Clin Diagn Res. 2014;8(5):OC01. doi:10.7860/JCDR/2014/8062.4212
CrossRef - Orlich MJ, Jaceldo-Siegl K, Sabaté J, Fan J, Singh PN, Fraser GE. Patterns of food consumption among vegetarians and non-vegetarians. Br J Nutr. 2014;112(10):1644. doi:10.1017/S000711451400261X
CrossRef - RDA National Institute of Nutrition, India. Accessed December 14, 2023. https://www.nin.res.in/RDA_Full_Report_2020.html
- Misra A, Singhal N, Sivakumar B, Bhagat N, Jaiswal A, Khurana L. Nutrition transition in India: Secular trends in dietary intake and their relationship to diet-related non-communicable diseases. J Diabetes. 2011;3(4):278-292. doi:10.1111/J.1753-0407.2011.00139.X
CrossRef - Venkatrao M, Nagarathna R, Majumdar V, Patil SS, Rathi S, Nagendra H. Prevalence of Obesity in India and Its Neurological Implications: A Multifactor Analysis of a Nationwide Cross-Sectional Study. Ann Neurosci. 2020;27(3-4):153-161. doi:10.1177/0972753120987465
CrossRef - Protein Consumption in Diet of Adult Indians : A General Consumer Survey (PRODIGY). Accessed December 14, 2023. https://imsear.searo.who.int/items/d1e6343a-a250-4d88-a674-6af6ca75c336
- Vecchio MG, Paramesh EC, Paramesh H, et al. Types of Food and Nutrient Intake in India: A Literature Review. Indian J Pediatr. 2014;81(1):17-22. doi:10.1007/S12098-014-1465-9/METRICS
CrossRef - Kahn HA, Whelton PK, Appel LJ, et al. Validity of 24-hour dietary recall interviews conducted among volunteers in an adult working community. Ann Epidemiol. 1995;5(6):484-489. doi:10.1016/1047-2797(95)00065-8
CrossRef - Swaminathan S, Vaz M, Kurpad A V. Protein intakes in India. British Journal of Nutrition. 2012;108(S2):S50-S58. doi:10.1017/S0007114512002413
CrossRef - Pomeroy E, Mushrif-Tripathy V, Cole TJ, Wells JCK, Stock JT. Ancient origins of low lean mass among South Asians and implications for modern type 2 diabetes susceptibility. Sci Rep. 2019;9(1). doi:10.1038/S41598-019-46960-9
CrossRef - Liu M, Zhang Z, Zhou C, et al. Predicted fat mass and lean mass in relation to all-cause and cause-specific mortality. J Cachexia Sarcopenia Muscle. 2022;13(2):1064-1075. doi:10.1002/JCSM.12921
CrossRef - Ioniță-Mîndrican CB, Ziani K, Mititelu M, et al. Therapeutic Benefits and Dietary Restrictions of Fiber Intake: A State of the Art Review. Nutrients. 2022;14(13). doi:10.3390/NU14132641
CrossRef - Bandyopadhyay S, Sinha S, Selvam S, Kurpad A V., Kuriyan R. Effect of a cereal and milk meal with or without fruits and nuts on the postprandial glycemic response in Indian men. Asia Pac J Clin Nutr. 2018;27(6):1243-1251. doi:10.6133/APJCN.201811_27(6).0011
- R. Hemalatha, A. Laxmaiah. What India Eats.; 2020.
- Mathur P, Kulothungan V, Leburu S, et al. National noncommunicable disease monitoring survey (NNMS) in India: Estimating risk factor prevalence in adult population. PLoS One. 2021;16(3). doi:10.1371/JOURNAL.PONE.0246712
CrossRef - Yun HR, Jo YH, Kim J, Shin Y, Kim SS, Choi TG. Roles of Autophagy in Oxidative Stress. Int J Mol Sci. 2020;21(9). doi:10.3390/IJMS21093289
CrossRef - Peña-Oyarzun D, Bravo-Sagua R, Diaz-Vega A, et al. Autophagy and oxidative stress in non-communicable diseases: A matter of the inflammatory state? Free Radic Biol Med. 2018;124:61-78. doi:10.1016/J.FREERADBIOMED.2018.05.084
CrossRef - Lapuente M, Estruch R, Shahbaz M, Casas R. Relation of Fruits and Vegetables with Major Cardiometabolic Risk Factors, Markers of Oxidation, and Inflammation. Nutrients. 2019;11(10). doi:10.3390/NU11102381
CrossRef - Oyebode O, Gordon-Dseagu V, Walker A, Mindell JS. Fruit and vegetable consumption and all-cause, cancer and CVD mortality: analysis of Health Survey for England data. J Epidemiol Community Health. 2014;68(9):856-862. doi:10.1136/JECH-2013-203500
CrossRef - Wang DD, Li Y, Bhupathiraju SN, et al. Fruit and Vegetable Intake and Mortality. Circulation. 2021;143(17):1642-1654. doi:10.1161/CIRCULATIONAHA.120.048996
CrossRef - Kim Y, Keogh JB, Clifton PM. Does Nut Consumption Reduce Mortality and/or Risk of Cardiometabolic Disease? An Updated Review Based on Meta-Analyses. Int J Environ Res Public Health. 2019;16(24). doi:10.3390/IJERPH16244957
CrossRef - Zhang X, Ou Y, Li L, et al. Associations of Nut Consumption with All-Cause Mortality among Individuals with Type 2 Diabetes. Journal of Nutrition. 2023;153(10):3003-3011. doi:10.1016/j.tjnut.2023.08.004
CrossRef - Li D. Omega-3 polyunsaturated fatty acids and non-communicable diseases: meta-analysis based systematic review. Asia Pac J Clin Nutr. 2015;24(1):10-15. doi:10.6133/APJCN.2015.24.1.21
- Terao J. Revisiting carotenoids as dietary antioxidants for human health and disease prevention. Food Funct. 2023;14(17):7799-7824. doi:10.1039/D3FO02330C
CrossRef - Simopoulos AP. An Increase in the Omega-6/Omega-3 Fatty Acid Ratio Increases the Risk for Obesity. Nutrients. 2016;8(3). doi:10.3390/NU8030128
CrossRef - Andarwulan N, Puspita NC, Saraswati, Średnicka-Tober D. Antioxidants such as flavonoids and carotenoids in the diet of Bogor, Indonesia residents. Antioxidants. 2021;10(4). doi:10.3390/ANTIOX10040587/S1
CrossRef - Imran M, Ghorat F, Ul‐haq I, et al. Lycopene as a Natural Antioxidant Used to Prevent Human Health Disorders. Antioxidants. 2020;9(8):1-27. doi:10.3390/ANTIOX9080706
CrossRef - Toti E, Oliver Chen CY, Palmery M, Valencia DV, Peluso I. Non-Provitamin A and Provitamin A Carotenoids as Immunomodulators: Recommended Dietary Allowance, Therapeutic Index, or Personalized Nutrition? Oxid Med Cell Longev. 2018;2018. doi:10.1155/2018/4637861
CrossRef - CONSUMPTION LEVELS OF SUGAR STUDY REPORT PART-1.
- Gulati S, Misra A. Sugar Intake, Obesity, and Diabetes in India. Nutrients. 2014;6(12):5955. doi:10.3390/NU6125955
CrossRef - Alexandratos Nikos, Bruinsma Jelle. WORLD AGRICULTURE TOWARDS 2030/2050 .; 2012.
- Turck D, Bohn T, Castenmiller J, et al. Tolerable upper intake level for dietary sugars. EFSA Journal. 2022;20(2):e07074. doi:10.2903/J.EFSA.2022.7074
CrossRef - Mediratta S, Mathur P. Nutritional Quality of Diets of Adults (20-40 Years) in Delhi, India. Indian J Nutr Diet. Published online September 1, 2023:334-350. doi:10.21048/IJND.2023.60.3.32325
CrossRef - Saini S, Saxena S, Samtiya M, Puniya M, Dhewa T. Potential of underutilized millets as Nutri-cereal: an overview. J Food Sci Technol. 2021;58(12):4465. doi:10.1007/S13197-021-04985-X
CrossRef - Anitha S, Kane-Potaka J, Tsusaka TW, et al. A Systematic Review and Meta-Analysis of the Potential of Millets for Managing and Reducing the Risk of Developing Diabetes Mellitus. Front Nutr. 2021;8:687428. doi:10.3389/FNUT.2021.687428/FULL
CrossRef - UNLEASHING THE POTENTIAL OF MILLETS International Year of Millets 2023 Background Paper. doi:10.4060/cc7484en
CrossRef - Ghosh P, Roychoudhury A. Nutrition and antioxidant profiling in the unpolished and polished grains of eleven indigenous aromatic rice cultivars. 3 Biotech. 2020;10(12):548. doi:10.1007/S13205-020-02542-5
CrossRef - Arlappa N. Vitamin A supplementation policy: A shift from universal to geographical targeted approach in India considered detrimental to health and nutritional status of under 5 years children. European Journal of Clinical Nutrition 2022 77:1. 2022;77(1):1-6. doi:10.1038/s41430-022-01122-5
CrossRef - Singh J, Dinkar A, Gupta P, Atam V. Vitamin B12 deficiency in northern India tertiary care: Prevalence, risk factors and clinical characteristics. J Family Med Prim Care. 2022;11(6):2381. doi:10.4103/JFMPC.JFMPC_650_21
CrossRef - Tiwari A, Singh RK, Satone PD, et al. Metformin-Induced Vitamin B12 Deficiency in Patients With Type-2 Diabetes Mellitus. Cureus. 2023;15(10). doi:10.7759/CUREUS.47771
CrossRef - Sivaprasad M, Shalini T, Reddy PY, et al. Prevalence of vitamin deficiencies in an apparently healthy urban adult population: Assessed by subclinical status and dietary intakes. Nutrition. 2019;63-64:106-113. doi:10.1016/J.NUT.2019.01.017
CrossRef - Naik S, Mahalle N, Bhide V. Identification of vitamin B12 deficiency in vegetarian Indians. Br J Nutr. 2018;119(6):629-635. doi:10.1017/S0007114518000090
CrossRef - Sundarakumar JS, Shahul Hameed SK, Ravindranath V. Burden of Vitamin D, Vitamin B12 and Folic Acid Deficiencies in an Aging, Rural Indian Community. Front Public Health. 2021;9:707036. doi:10.3389/FPUBH.2021.707036/BIBTEX
CrossRef - Chaudhary V, Saraswathy K, Sarwal R. Dietary diversity as a sustainable approach towards micronutrient deficiencies in India. Indian Journal of Medical Research. 2022;156(1):31-45. doi:10.4103/IJMR.IJMR_3314_21
CrossRef - The Vitamins: Fundamental Aspects in Nutrition and Health – Gerald F. Combs Jr., James P. McClung – Google Books. Accessed December 15, 2023. https://books.google.co.in/books?id=UEy0DAAAQBAJ&pg =PR3&source= gbs_selected_pages&cad=2#v=onepage&q&f=false
- Mosegaard S, Dipace G, Bross P, Carlsen J, Gregersen N, Olsen RKJ. Riboflavin Deficiency—Implications for General Human Health and Inborn Errors of Metabolism. International Journal of Molecular Sciences 2020, Vol 21, Page 3847. 2020;21(11):3847. doi:10.3390/IJMS21113847
CrossRef - Nitzan YB, Cohen AD. Zinc in skin pathology and care. J Dermatolog Treat. 2006;17(4):205-210. doi:10.1080/09546630600791434
CrossRef - Maares M, Haase H. A Guide to Human Zinc Absorption: General Overview and Recent Advances of In Vitro Intestinal Models. Nutrients. 2020;12(3). doi:10.3390/NU12030762
CrossRef - Wright JA, Richards T, Srai SKS. The role of iron in the skin and cutaneous wound healing. Front Pharmacol. 2014;5. doi:10.3389/FPHAR.2014.00156
CrossRef - Ministry of Health and Family Welfare India Fact Sheet.
- Farapti F, Buanasita A, Atmaka DR, et al. Potassium intake is associated with nutritional quality and actual diet cost: a study at formulating a low sodium high potassium (LSHP) healthy diet. J Nutr Sci. 2022;11:e11. doi:10.1017/JNS.2021.104
CrossRef - World Health Organisation. Guideline: Potassium Intake for Adults and Children. World Health Organization. 2012;(ISBN 978 92 4 150483 6):56. Accessed December 14, 2023. https://www.ncbi.nlm.nih.gov/books/NBK132470/
- McDonough AA, Youn JH. Potassium Homeostasis: The Knowns, the Unknowns, and the Health Benefits. Physiology (Bethesda). 2017;32(2):100-111. doi:10.1152/PHYSIOL.00022.2016
CrossRef - Burnier M. Should we eat more potassium to better control blood pressure in hypertension? Nephrol Dial Transplant. 2019;34(2):184-193. doi:10.1093/NDT/GFX340
CrossRef - Kapil U, Bhadoria AS. Prevalence of Folate, Ferritin and Cobalamin Deficiencies amongst Adolescent in India. J Family Med Prim Care. 2014;3(3):247. doi:10.4103/2249-4863.141619
CrossRef - Yadav K, Pandav CS. National Iodine Deficiency Disorders Control Programme: Current status & future strategy. Indian J Med Res. 2018;148(5):503. doi:10.4103/IJMR.IJMR_1717_18
CrossRef - Rana R, Raghuvanshi RS. Effect of different cooking methods on iodine losses. J Food Sci Technol. 2013;50(6):1212. doi:10.1007/S13197-011-0436-7
CrossRef - Naithani M, Bharadwaj J, Darbari A. Magnesium: The fifth electrolyte. Journal of Medical Nutrition and Nutraceuticals. 2014;3(2):66. doi:10.4103/2278-019X.131955
CrossRef - Reddy P, Edwards LR. Magnesium Supplementation in Vitamin D Deficiency. Am J Ther. 2019;26(1):e124-e132. doi:10.1097/MJT.0000000000000538
CrossRef - Costello RB, Rosanoff A, Dai Q, Saldanha LG, Potischman NA. Perspective: Characterization of Dietary Supplements Containing Calcium and Magnesium and Their Respective Ratio—Is a Rising Ratio a Cause for Concern? Advances in Nutrition. 2021;12(2):291. doi:10.1093/ADVANCES/NMAA160
CrossRef - Rosanoff A. Perspective: US Adult Magnesium Requirements Need Updating: Impacts of Rising Body Weights and Data-Derived Variance. Advances in Nutrition. 2021;12(2):298. doi:10.1093/ADVANCES/NMAA140
CrossRef - Hartwig A. Role of magnesium in genomic stability. Mutation Research – Fundamental and Molecular Mechanisms of Mutagenesis. 2001;475(1-2):113-121. doi:10.1016/S0027-5107(01)00074-4
CrossRef - Moscatelli F, Sessa F, Valenzano A, et al. COVID-19: Role of Nutrition and Supplementation. Nutrients. 2021;13(3):1-12. doi:10.3390/NU13030976
CrossRef - Lee S, Choi Y, Jeong HS, Lee J, Sung J. Effect of different cooking methods on the content of vitamins and true retention in selected vegetables. Food Sci Biotechnol. 2018;27(2):333. doi:10.1007/S10068-017-0281-1
CrossRef - USDA Table of Nutrient Retention Factors: U.S. Department of Agriculture; December 2007. Release 6. https://www.ars.usda.gov/ARSUserFiles/80400530/pdf/retn06.pdf
- Kaur J, Kaur M, Chakrapani V, Kumar R. Multilevel Influences on Fat, Sugar, Salt, Fruit, and Vegetable Consumption Behaviors Among Urban Indians: Application of the Social Ecological Model. Sage Open. 2020;10(2). doi:10.1177/2158244020919526/ASSET/IMAGES/LARGE/10.1177_2158244020919526-FIG1.JPEG
CrossRef
Abbreviations
AI- Adequate Intake
ALA- Alpha linoleic Acid
BMI- Body Mass Index
CVD- Cardio Vascular Diseases
DHA- Docosahexaenoic Acid
EAR- Estimated Average Requirements
EFSA- European Food Safety Authority
EPA- Eicosapentaenoic Acid
F&V- Fruits and Vegetables
FAO- Food Agriculture Organization
FFQ- Food Frequency Questionnaire
ICMR- Indian Council of Medical Research
IDD- Iodine Deficiency Disorders
IFCT- Indian Food Composition Table
NAR- Nutrient Adequacy Ratio
NCD- Non-Communicable Disorders
NFHS-5- National Family Health Survey-5
NIN- National Institute of Nutrition
NISI- National Iodine Salt Intake
RDA- Recommended Dietary Allowance
SD- Standard Deviation
USI- Universal Salt Iodization
WHO- World Health Organization

This work is licensed under a Creative Commons Attribution 4.0 International License.


