
Introduction
Gelatin, a biopolymer of significant industrial value, is derived from the partial hydrolysis of collagen found in animal skin, bones, hides, and connective tissues. Comprising amino acids like proline, hydroxyproline, and glycine, arranged in a glycine-X-Y peptide triplet structure, gelatin’s unique molecular configuration endows it with properties critical for various applications in food processing, pharmaceuticals, and cosmetics1. The utility of gelatin hinges on its ability to form gels, enhance texture, and interact synergistically with other biomolecules, properties that are influenced by the source material and the methods used for its extraction and purification.
Traditionally, gelatin extraction involves pretreating collagenous materials with either acidic or alkaline solutions to facilitate the conversion of collagen into gelatin. While acidic solutions typically result in gelatin with single peptide chains, alkaline treatments can produce gelatin with double peptide chains2,3. However, these conventional methods often involve lengthy processing times and can negatively impact the functional properties of the resultant gelatin. Moreover, there is growing concern over these traditional extraction processes’ environmental impact and cost-efficiency4.
Recent advances suggest that ultrasound, through its cavitation effects, can potentially modify the structure and enhance the functional properties of proteins such as collagen. Ultrasound waves propagate through liquids, generating alternating high- and low-pressure cycles known as acoustic cavitation. This cavitation effect can break the cell membrane, allowing the extraction of the skin matrix without compromising its structural integrity5–7. Ultrasound-assisted extraction is an efficient method in the food industry that increases yields and improves functional properties8. It enhances the protein properties of gelatin by disrupting the collagen structure in the goat skin matrix. This leads to the release of gelatin and enhances its solubility in solvents, accelerating the extraction process. By applying ultrasound during or before hydrolysis, it is possible to disrupt hydrogen bonds and hydrophobic interactions within the protein structure, leading to a more efficient breakdown of the collagen matrix and, consequently, a higher yield of gelatin2,3,9. This innovative approach not only promises to expedite the extraction process but also to improve the yield and quality of gelatin extracted from sources like goat skin, which is rich in type I collagen8.
Ultrasound-assisted extraction shows promise in extracting gelatin from goat skin when combined with acid pretreatment. However, there is a lack of research in this area. Using this innovative approach, we can expedite the extraction process, improve yield, and enhance the quality of gelatin, contributing to environmental sustainability. In this study, we aim to compare the efficiency, quality, and functional properties of gelatin obtained through a novel combination of acetic acid and ultrasound pretreatment with those produced via conventional methods. This comparison will highlight the potential of this approach to improve gelatin production and set a new industry benchmark.
Materials and Methods
Materials
The goat skins (Capra aegagrus hircus), about 2-3 years old, were taken from a slaughterhouse in Minburi, Bangkok, Thailand. All analytical-grade chemicals, such as sodium hydroxide, hydrochloric acid, and glycerol, were purchased from Sigma-Aldrich (St. Louis, MO, USA).
Preparation of the skin sample
The freshness of the goat skin was maintained before further use by placing it in polyethylene bags and stored at -20 oC in the School of Food Industry laboratory, King Mongkut’s Institute of Technology Ladkrabang. Before removing the hair, the frozen skin was thawed with 30 oC running water for 15 min. Subcutaneous fat was scraped and cut into 10 x 10 cm sections. The skin was treated to remove any hair, meat, or fat. This was done by soaking it in a 0.5 M NaOH solution (in ratio 1:10 (w/v)) for 24 h at 4 oC. Once this process was complete, the alkaline treated skin was further cleaned and neutralized by soaking it in running water overnight. Finally, the skin was cut into 1 x 1 cm pieces for further use.
Acid Pretreatment
Acid pretreatment following the method of Mulyani et al.10 with some modifications. The prepared skin (100 g) was pretreated with acetic acid by soaking in 0.5 M acetic acid (pH 2.5) with a sample/acid solution ratio of 1:10 (w/v). The mixture was stirred with an overhead stirrer (RW20 digital, IKA-Werke GmbH & Co. KG, Germany) at 150 rpm for 2 h at 4 oC. Subsequently, the skin was washed with running tap water until the washing water reached pH 7. Finally, the skin was drained for 1.5 h until it no longer dripped water.
Acid – Ultrasound Pretreatment
The prepared skin (100 g) underwent an acid pretreatment, as previously described, before being added to distilled water in ratio 1:3 (w/v). Subsequently, it was subjected to ultrasonication using a reactor vibrating cell (model VC 750, Sonic & Materials INC, USA) equipped with a 25 mm probe working at 20 kHz and a power of 750 W. Ultrasonication was performed for 30 min at an amplitude of 80% with a pulse reaction of 5 s and a rest time of 5 s. The sample temperature was maintained at 25±2 oC using a thermometer.
Gelatin Extraction
Gelatin extraction was carried out according to the method of Ahmad et al.11 with some modifications. The study compared three skin samples: untreated skin (control: T0), skin treated with acetic acid (T1), and skin treated with a combination of acetic acid and ultrasound (T2). Each skin sample was suspended in distilled water in a ratio of 1:3 (w/v) and incubated at 60 oC in a water bath (Memmert GmbH + Co. KG) for 24 h. The gelatin extract was then filtered using three layers of cheesecloth and then further filtered using Whatman filter paper No. 4 (Whatman International, Ltd., Maidstone, England). The gelatin extract obtained was concentrated using an evaporator (Rotavapor® R-100, Buchi Ltd., Switzerland) for 2 h at 45 oC. The concentrated gelatin was then freeze-dried (CoolSafe Pro, LaboGene A/S, Lynge, Denmark). The yield of the obtained gelatins was calculated based on dried weight. A schematic flow diagram of gelatin production is presented in Figure 1.
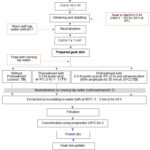 |
Figure 1: Schematic flow diagram of goat skin gelatin production |
Characterization of goat skin gelatin
Yield
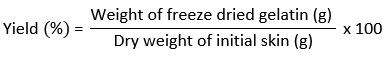
The yield of gelatin production was calculated according to Ahmad et al.11 using the formula:
Determination of the hydroxyproline content
The hydroxyproline content was determined using the method described by Bergman and Loxley12. The samples were hydrolyzed with 6M hydrochloric acid at 110 oC for 24 h in an oil bath. The hydrolysate was then filtered through Whatman No. 4 filter papers. The filtrate was neutralized with 6M and 1M sodium hydroxide to reach a pH of 6.0-6.5. The neutralized sample was diluted and placed in a test tube. 2.5 mL of an oxidizing solution containing 7% chloramine-T and acetate/citrate buffer (pH 6) were added in 1:4 ratios. 3 mL of Erlich’s reagent solution was added to the mixture, containing 2.5 mL of p-dimethylaminobenzaldehyde, 60% perchloric acid (3.75 mL) and 2-propanol (26.41 mL). The mixture was mixed and heated at 60 oC for 25 min, then cooled to room temperature before mixing with 1.65 mL of 2-propanol. The absorbance of the sample was measured as the optical density at 558 nm using a spectrophotometer (UV-1200, Shanghai MAPADA Instruments Co. Ltd, China). At the same time, standard hydroxyproline solutions with concentrations ranging from 3.5 to 60 mg/mL were also run.
Analysis of Physicochemical Properties
Measurement of Water Activity
The water activity of the gelatin samples was determined according to the method of Cansu13, using an Aqualab 4TE (Decagon Devices Inc., USA). Before calibration, deionized water was used with an accuracy level of ± 0.1 oC, a resolution of 0.01 oC, and a repeatability rate of 0.001. The gelatin samples were placed in plastic cups in an amount that did not exceed the capacity of the plastic cups.
Moisture Content
The moisture content of the sample was determined according to Duthen et al.14 with slight modifications. The gelatin sample (2 g) was dried in an oven at 105 ± 1 oC for 18 h, cooled for 30 min in a desiccator, and weighed. The oven drying process was repeated for 1 h to achieve a constant weight.
Color Measurement
The color of the gelatin samples was measured following the method of Erge and Eren15. Gelatin solution (6.67%) was prepared and subjected to color measurement using a Minolta CR400 chroma meter model CR400 (Minolta, Japan). The color was expressed in L* (lightness), a* (redness/greenness), and b* (yellowness/blueness).
Determination of Turbidity
The turbidity was determined using the method of Ahmad et al.11 with slight modifications. The gelatin sample (0.1 g) was dissolved in distilled water (20 mL) at 60 oC to make a 0.5% solution (w/w). Turbidity was measured with a TurbiCheck TB 211 IR (Lovibond, Germany) and expressed in the nephelometric turbidity unit (NTU). The tool had to be calibrated with four turbidity standards (0.1, 20, 200, and 800 NTU) prior to use.
Determination of Viscosity
The viscosity of a gelatin sample was determined using the method of Ahmad et al.11 with some modifications. To prepare a gelatin solution (6.67% w/v), 1.34 g of the gelatin sample was dissolved in 20 mL of distilled water and heated at 55 oC. The viscosity of the gelatin solution was then measured at room temperature using a Brookfield DV-III Ultra (Brookfield Engineering Laboratories, Inc., USA) with spindle no. 31 at a speed of 100 rpm.
Determination of Gel Strength
The gel strength was determined following the method of Ahmad et al.11 with a slight modification. To prepare the gelatin solution (6.67% w/v), 1.34 g of gelatin were dissolved in 20 mL of distilled water in a 25 mL beaker at 55 oC. The solution was stirred until it was dissolved and then stored at 5-7 oC for 16-18 h to set the gel. Gel strength was measured using a texture analyzer Model TA-XT2i (Stable Micro Systems, Surrey, UK) with a P/0.5R probe.
Determination of Melting Point
The melting point of gelatin was determined using the method of Hidayati et al.16 with some modifications. Dry foam gelatins were dissolved in distilled water to a concentration of 6.67% w/v (melted at 60-65°C). The mixture was then further homogenized using a magnetic stirrer. Subsequently, the samples were stored at approximately 10 oC for a duration of 17±2 h. To measure the melting points, the samples were heated in a water bath. A buckshot ball was placed on the gelatin surface, and the temperature at which the gel-sol transition occurred, as evidenced by the movement of the buckshot ball falling to the bottom of the sample, was recorded as the melting point temperature.
Determination of pH
pH measurement was carried out using the method developed by Moosavi‐Nasab et al.17 with slight modifications. To prepare a 6.67% (w/v) gelatin solution, 1.34 g of gelatin samples were dissolved in 20 mL of distilled water at 55 °C, stirred until fully dissolved and allowed to cool to room temperature. The pH of the gelatin solution was measured with a pH meter (AG 8603, Mettler Toledo, Switzerland) calibrated with standard pH buffers of 4.0, 7.0, and 9.0.
Sodium Dodecyl Sulfate-polyacrylamide Gel Electrophoresis (SDS-PAGE)
SDS-PAGE was performed according to the method of Laemmli18 with slight modification. The gelatin solution (10 mg/mL) was mixed with 5% SDS (w/v) in a final volume of 30 mL and incubated at 85 oC for 1 h. The solubilized samples were mixed in a 1:1 ratio (v/v) with the sample buffer (0.5 M Tris-HCl, pH 6.8, containing 4% (w/v) SDS, 20% (v/v) glycerol) in the presence of 10% (v/v) βME. The protein sample (15 µg) was loaded onto a polyacrylamide gel composed of 10% separating gel and 4% stacking gel. The gel was then subjected to electrophoresis at a constant current of 20 mA/gel, using an electrophoresis apparatus (AE-6440, Atto Co., Tokyo, Japan). Subsequently, the gel was stained with 0.05% (w/v) Coomassie Brilliant Blue G-250 and destained with 30% methanol and 10% acetic acid. To estimate the molecular weight of proteins, Precision Plus ProteinTM unstained standard (10-250 kDa) (Bio-Rad, CA, USA) was used as standard markers of molecular weight protein, which were performed in the same manner.
Functional Properties of Goat Skin Gelatin
Determination of Protein Solubility
The solubility of gelatin was determined at various pH levels and NaCl concentrations using a modified version of the method of Jamilah et al.19 with some modifications. Gelatin samples were dissolved in 0.5 M acetic acid to obtain a final concentration of 3 mg/mL. To determine the solubility of gelatin affected by pH, 5 mL of gelatin solution was placed in a series of centrifuge tubes. The pH was adjusted to values ranging from 2 to 10 with 6M NaOH or 6M HCl. Distilled water was added to each tube to bring the total volume to 10 mL. The solution was gently stirred for 30 min at 4 oC and centrifuged at 6000 xg for 10 min. An aliquot (1 mL) of the supernatant was collected from each tube, and its protein content was measured using the Biuret method. The pH resulting in the highest solubility was used to calculate the relative solubility of gelatin.
To study the effect of NaCl concentration on gelatin solubility, the gelatin solution (5 mL) was mixed with 5 mL of NaCl in acetic acid of varying concentrations (0-12 %, w/v) to obtain final concentrations of 1 to 6 % (w/v). The solution was gently stirred for 30 min at 4 oC and centrifuged at 6000 xg for 10 min. The protein content in the supernatant was determined using the Biuret method with bovine serum albumin as standard. The relative solubility was calculated by comparing it with the solubility at the NaCl concentration with the highest solubility.
Determination of Emulsifying Properties
The emulsifying activity index (EAI) and the emulsifying stability index (ESI) of the gelatin solution were determined according to the method of Pearce & Kinsella20 with some modifications. Soybean oil (2 mL) and 6 mL of 0.1% protein solution at pH 7.0 were mixed in a mechanical homogenizer (HG-15A, DAIHAN Scientific Co., Ltd. Korea) at a speed of 20,000 rpm for 1 min. After homogenization, 50 μL portions of the resulting emulsions were pipetted from the bottom of the container at 0 and 10 min. Each portion was diluted with 5 mL (500 times) of 0.1% SDS solution. The absorbance of these diluted emulsions was measured at 500 nm (using a V-1200 spectrophotometer, MAPADA Instruments Co., Ltd. China) to obtain EAIRT.
To carry out EAI80, the emulsions were heated at 80 oC for 30 min in the water bath. Then, they were diluted 500 times with 0.1% SDS containing 0.1 NaCl (pH 7), and their absorbance was read at 500 nm.
EAI (m2/g) = (2 x 2.303 x A500 x DF) / (ℓ x Φ x C)
Where DF is the dilution factor (500), ℓ = cuvette path length (m), Φ = oil volume fraction, and C = protein concentration in aqueous phase (g/m3).
ESI (min) = ((EAIRT – EAI80)/ EAIRT) x 100
Where EAIRT and EAI80 are the EAI determined before and after being heated at 80 oC, respectively.
Fourier Transform Infrared (FTIR) Analysis.
FTIR analysis was carried out following the method of Indriani et al.21 with some modifications. The instrument used was a Bruker INVENIO® Spectrometer (Bruker Optics, Germany), with data controlled by OPUS v8.5 software. Spectra was collected in transmission mode in the range of 4000-500 cm-1 with a resolution of 4 cm-1. Signals were auto-collected in 32 scans and normalized against background spectra recorded from clean, blank cells at 25 oC. The transmitted data that was collected then was determined by the region and peak wavenumber using the OriginPro®2023 software.
Statistical Analysis
Data were analyzed using the Social Sciences Statistical Package (SPSS version 28.0, IBM, USA). To evaluate differences between means, one-way analysis of variance (ANOVA) and Duncan’s multiple range test were used. All experiments were carried out in triplicate.
Results
Yield and Hydroxyproline Content
The yield of gelatin refers to the amount of dry gelatin produced from raw skin material during the extraction process. This study indicates a significant increase in yield (p<0.05) (Table 1). The highest yield was observed at T2 (49.24±0.51%), followed by T1 (29.95±0.13%), and the lowest yield was at T0 (25.48±0.37%). The use of acetic acid pretreatment followed by ultrasound had a major impact on the yield.
The results presented in Table 1 show that there was a significant difference (p<0.05) in the hydroxyproline content. The hydroxyproline content of T2 (231.31±4.34 mg/g) was found to be significantly higher than that of T1 (114.94±0.53 mg/g) and T0 (102.07±1.55 mg/g). This suggests that the hydroxyproline content is directly proportional to the yield produced.
Table 1: Yield and hydroxyproline content of gelatin extracted from goat skin pretreated with acetic acid (T1), acetic acid followed by ultrasound (T2), and without pretreatment (T0).
| Gelatins | Yield (%) | Hydroxyproline (mg/g) |
| T0 | 25.48±0.37a | 102.07±1.55a |
| T1 | 29.95±0.13b | 114.94±0.53b |
| T2 | 49.24±0.51c | 231.31±4.34c |
Data are expressed as mean ± standard deviation (n=3).
Different superscript letters in the same column indicate significant differences (p≤0.05).
Water Activity and Moisture Content
The investigation of water activity and moisture content results are presented in Figure 2. The study found that the water activity of gelatin was highest in T2 (0.3176±0.01 Aw), which was substantially different (p<0.05) from T1 (0.1717±0.02 Aw) and T0 (0.1850±0.01 Aw). This result indicates that ultrasonics can effectively enhance gelatin water activity. In Figure 2, the moisture content data of gelatin is displayed. It shows that T2 had a higher moisture content (10.94±0.01%) as compared to T1 (10.18±0.01%) and T0 (10.17±0.01%). This difference was statistically significant (p<0.05). The high moisture content of T2 was due to the frequency of ultrasound used during extraction, which impacted the molecular structure of water in the goat skin.
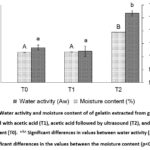 |
Figure 2: Water activity and moisture content of of gelatin extracted from goat skin pretreated with acetic acid (T1), acetic acid followed by ultrasound (T2), and without pretreatment (T0). |
Color and Turbidity
Table 2 shows the color data for goat skin gelatin in this study. The a* color value of goat skin gelatin was significantly higher at T2 than at T1 and T0 (p<0.05). T0 had a greener tone, while T1 had a more red color. T0 also exhibited a brighter hue than T2 and T1 (p<0.05). T1 had the lowest b* value of -0.84±0.03. T0 had the highest L* color indicator of 47.38±0.03. Based on the L* color notation in Table 2, T0 was lighter than gelatin T1 and T2 (p<0.05). The gelatin had bright colors that were different from those of the turbidity, which was not clear.
According to Table 2, all treatments in the study had varying turbidity levels (p<0.05). T2 had the lowest turbidity level (106.33±0.94 NTU), which means it was the clearest of all the treatments. On the other hand, T1 had the highest turbidity level (254.33±0.47 NTU), which made it the cloudiest. Furthermore, Figure 3 also illustrates the turbidity levels of gelatin in this study. T2 appeared clearer than T0 and T1.
Table 2: The turbidity and colors of gelatin extracted from goat skin pretreated with acetic acid (T1), acetic acid followed by ultrasound (T2), and without pretreatment (T0).
| Sample | Turbidity (NTU) | Colors | ||
| L * | a* | b* | ||
| T0 | 251.00±0.82a | 47.38±0.03a | -1.35±0.01a | -5.02±0.03a |
| T1 | 254.33±0.47b | 38.57±0.02b | 0.35±0.00b | -0.84±0.03c |
| T2 | 106.33±0.94c | 35.48±0.18c | 1.07±0.05c | -1.61±0.03b |
Data are expressed as mean ± standard deviation (n=3).
Different superscript letters in the same column indicate significant differences (p≤0.05).
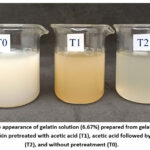 |
Figure 3: The appearance of gelatin solution (6.67%) prepared from gelatin extracted from goat skin pretreated with acetic acid (T1), acetic acid followed by ultrasound (T2), and without pretreatment (T0). |
Viscosity and Gel Strength
According to Table 3, there was a significant difference (p<0.05) in the viscosity of gelatin among the various samples. The viscosity value of gelatin in T0 was 6.80±0.33 cP, T1 was 11.20±0.75 cP, and T2 was 48.00±4.27 cP. Sample T1, which underwent pretreatment with acetic acid, exhibited higher viscosity compared to T0. This indicates that the pretreatment with acetic acid has a significant impact on increasing the viscosity of gelatin. Additionally, the viscosity of sample T2, which underwent acetic acid pretreatment followed by ultrasound, was higher than that of sample T1. These results indicate that the combination of acetic acid pretreatment and ultrasound has a significant impact on increasing the viscosity of gelatin.
The results displayed in Table 3 indicate that there are significant differences among the samples (p<0.05) in terms of their gel strength. The gel strength values were 4.76±0.38 g for T0, 197.62±21.5 g for T1, and 334.88±10.15 g for T2. These findings suggest that both T1 and T2 samples have a significant impact on improving gelatin strength when compared to T0 (control). Furthermore, T2 showed higher gel strength than T1, indicating that the sample with T2, which combines acetic acid pretreatment with ultrasound, is highly effective in strengthening gelatin.
Table 3: The gel strength, viscosity, and pH of gelatin extracted from goat skin pretreated with acetic acid (T1), acetic acid followed by ultrasound (T2), and without pretreatment (T0).
| Sample | Gel Strength (g) | Viscosity (cP) | Melting point (oC) | pH |
| T0 | 4.76±0.38a | 6.80±0.33a | 32.47±0.02a | 6.37±0.04b |
| T1 | 197.62±21.50b | 11.20 0.75a | 34.53±0.06b | 6.38±0.03b |
| T2 | 334.88±10.15c | 48.00±4.27b | 35.85±0.25c | 6.06±0.04a |
Data are expressed as mean ± standard deviation (n=3).
Different superscript letters in the same column indicate significant differences (p≤0.05).
Melting Point
Table 3 displays the melting point of the gelatins. All treatments showed a significant difference (p<0.05) in their melting point. Acetic and ultrasound pretreatment led to an increase in melting point. The lowest melting point was observed at T0 (32.47±0.02 oC), followed by an increase at T1 (34.53±0.06 oC), and the highest melting point was recorded at T2 (35.85±0.25 oC).
pH
According to Table 3, there are no significant differences between T0 and T1 (p>0.05), with pH values of 6.36 and 6.38, respectively. This is because both samples underwent the same washing and neutralizing process using running water. Additionally, the table indicates that treating the gelatin with acetic acid did not have a significant effect on the pH changes. However, T2 shows a slightly lower pH of 6.03, indicating that the combination of acetic acid and ultrasound can cause a significant decrease in the pH of the gelatin.
Sodium Dodecyl Sulfate-polyacrylamide Gel Electrophoresis (SDS-PAGE)
The SDS-PAGE patterns of goat skin gelatins prepared with various pretreatments are depicted in Figure 4, which illustrates the distinct molecular weight distribution patterns. The highest molecular weight distribution for T2 is 175 kDa, in contrast to T0 and T1, which are 75 – 127 kDa. Notably, the β chain is exclusively visible in T2. The α1 and α2 chains demonstrate low intensity in T0 and T1. This phenomenon is attributed to the significant impact of the pretreatment effect observed in this study. Additionally, the results suggest that the application of ultrasound enhances band intensity, indicative of a higher protein concentration.
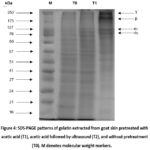 |
Figure 4: SDS-PAGE patterns of gelatin extracted from goat skin pretreated with acetic acid (T1), acetic acid followed by ultrasound (T2), and without pretreatment (T0). M denotes molecular weight markers. |
Solubility of Goat Skin Gelatins
Figure 5 shows the effects of pH and NaCl on the relative solubility of goat skin gelatins. All gelatins showed similar pH behavior. Solubility was higher at low pH, with a maximum at pH 2, the lowest pH studied. The lowest solubility was observed at a pH close to neutral (Figure 5A). The decrease in gelatin solubility could be related to hydrophobic interactions that occur between gelatin molecules in solution.
In Figure 5B, the relative solubility of the three types of goat skin gelatin increases significantly when the NaCl concentration is 2%. However, when the NaCl concentration is 4%, collagen solubility decreases. This decline in solubility may be due to salt deposition at higher NaCl concentrations.
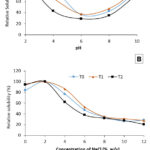 |
Figure 5: Effect of pH (A) and NaCl concentration (B) on the solubility of gelatin extracted from goat skin pretreated with acetic acid (T1), acetic acid followed by ultrasound (T2), and without pretreatment (T0). |
Emulsifying Properties
The emulsifying properties of gelatins from goat skin are presented in Figure 6. The results showed that there are significant differences (p<0.05) among the three samples of goat skin gelatin in terms of their emulsifying activity index (EAI). The lowest EAI value was observed in T0 (18.24±0.20 m2/g), followed by an increase in T1 (23.58±0.34 m2/g), and the highest value was recorded in T2 (30.89±1.42 m2/g). The emulsion stability index (ESI) showed a significant increase (p<0.05). The lowest value was observed in T0 (24.90±2.13 min), followed by an increase in T1 (46.64±1.78 min), and the highest in T2 (62.63±2.20 min). This increase is attributed to the influence of acetic acid pretreatment and ultrasound, which contributed to the improved stability of the emulsion.
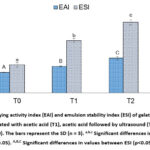 |
Figure 6: Emulsifying activity index (EAI) and emulsion stability index (ESI) of gelatin extracted from goat skin pretreated with acetic acid (T1), acetic acid followed by ultrasound (T2), and without pretreatment (T0). |
Fourier Transforms Infrared (FTIR) Spectra
The FTIR analysis of gelatins from goat skin (as shown in Table 3) identified various regions and peak wavenumbers. These included Amide A (3294.33-3296.61 cm-1), Amide B (2919.99-2921.04 cm-1), Amide I (1627.72-1633.44 cm-1), Amide II (1541.98-1543.41 cm-1), and Amide III (1080.38-1081.81 cm-1). The findings in Table 4 were also confirmed in Figure 7, which indicated that despite minimal shifts in peak wavenumbers, there were molecular interactions due to the effects of acetic acid pretreatment and ultrasound.
Table 4: FTIR spectra and peak positions of gelatins extracted from goat skin pretreated with acetic acid (T1), acetic acid followed by ultrasound (T2), and without pretreatment (T0).
| Regions | Peak wavenumber (cm-1) of gelatins from goat skin | ||
| T0 | T1 | T2 | |
| Amide A | 3294.33 | 3295.85 | 3296.61 |
| Amide B | 2919.99 | 2920.75 | 2921.04 |
| Amide I | 1627.72 | 1632.01 | 1633.44 |
| Amide II | 1543.41 | 1541.98 | 1543.41 |
| Amide III | 1080.38 | 1081.81 | 1081.81 |
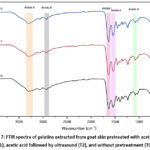 |
Figure 7: FTIR spectra of gelatins extracted from goat skin pretreated with acetic acid (T1), acetic acid followed by ultrasound (T2), and without pretreatment (T0). |
Discussion
Yield and Hydroxyproline Content
Based on Table 1, the gelatin yield in this study ranged from 25.48% to 49.24%. The highest yield was recorded in T2, followed by T1 and T0. The impact of ultrasound on the yield is quite evident. Acetic acid also enhances the yield, but it is most effective when used in conjunction with ultrasound. The use of ultrasound causes the degradation of the gelatin polypeptide chain, leading to an increase in extraction duration. This is evident in the gelatin protein pattern, which shows a reduction in α- and -gelatin chains. Ultrasound can break the hydrogen and covalent bonds that hold the gelatin polypeptide chains together, changing gelatin’s molecular structure from helices to coils. The α- and β- chains of gelatin are helical forms consisting of three twisted polypeptide chains. If these chains are broken by ultrasound, then the gelatin protein pattern will show a loss of the bands corresponding to the α- and β-gelatin chains2. Ultrasound can increase the penetration of the acetic acid solvent into the sample matrix and accelerate mass transfer by producing imploded microbubbles (acoustic cavitation) and generating high-pressure and frictional waves (mechanical ultrasound effect). This can improve the efficiency of extracting gelatin from raw materials22. The results were similar to those reported by Ahmad et al.11 who found that using ultrasound to pre-treat bovine hide and then subjecting it to ultrasound for 6 hours at 60°C increased the yield of gelatin to 19.71%.
The hydroxyproline content of gelatins from goat skin prepared from different pretreatments is shown in Figure 1. Collagen is a protein containing hydroxyproline, which is the main indicator of gelatin, as it is produced by the partial hydrolysis of collagen. Because hydroxyproline is almost absent in proteins other than collagen and gelatin, the content of hydroxyproline in gelatin can be used as an indicator of the collagen content in gelatin23. A high yield of gelatin indicates that many collagens have been successfully converted into gelatin. Because collagen is rich in hydroxyproline, collagen-derived gelatin will also be rich in hydroxyproline11.
Water Activity and Moisture Content
As per Figure 2, the water activity of T2 is higher than T0 and T1, indicating that ultrasound can stretch collagen triple helix bonds in gelatin, allowing water to enter and get trapped inside. Ultrasound can enhance the water activity of gelatin using the subcritical water extraction technique5,24. However, the ultrasonic process has different effects on water activity depending on many things, such as the frequency, intensity, duration, and temperature of ultrasound, as well as gelatin concentration and temperature25,26. The water activity of gelatin obtained from acid treatment is a determinant of the physicochemical properties of gelatin11. Water activity quantifies the extent to which water is accessible for chemical reactions or the proliferation of microorganisms27, reducing water activity can increase the stability and shelf life28. The quality and stability of gelatin is affected by its water activity, which is determined by its ability to absorb and release water based on environmental conditions. The activity of water in gelatin can impact its ability to create hydrogels, which are networks that contain bound water25. Excess water activity can lead to gelatin absorbing moisture from the surrounding air, resulting in the hydrogel being soft or moist. This can have an impact on the microstructural stability and mechanical properties of gelatin26.
The high moisture content of T2 is due to the frequency of ultrasound, which impacts the molecular structure of water extracted from goat skin. The use of ultrasound can increase the rate of mass transfer, reduce the extraction time, and increase the yield of gelatin29. Ultrasound can change the amount of water in gelatin by changing the hydrogen bonds between water molecules and goat skin, lowering the surface tension of water, making it easier for water to diffuse, and creating cavitation24,30. This water content influences the quality, stability, and shelf life of food. Moisture content is the amount of water contained in the food.
Color and Turbidity
The a* value was significantly higher in T2 than T1 and T0 (p<0.05), indicating a noticeable color change. T0 was greener and brighter than T1, while T1 had a more red color. T0 also had the highest L* value, meaning a lighter color than T1 and T2 (p<0.05). T1 had the lowest b* value of -0.84±0.03. Based on the results, there are changes in the color profile of goat skin gelatin over time. This is due to the difference in the sample types used for measurement. The foam sample was used to measure color, while the solution sample was used to measure turbidity. Furthermore, the combined use of acetic acid and ultrasound during preparation led to a decrease in the brightness of the gelatin. The acid pretreatment could cause the protein in gelatin to change or break its structure. This could make gelatin less clear and transparent31. The change could be caused by acids, which damage the structure and bonds of the gelatin. Furthermore, using ultrasonic waves when skin is extracted could change the composition of gelatin32. Ultrasonic cavitation changed the mechanical properties of the gelatin network by breaking protein bonds and changing the texture24. Ultrasound treatment can lead to redder gelatin but doesn’t affect brightness or yellowness significantly compared to using only acetic acid or no pretreatment.
Turbidity is a term used to describe the level of cloudiness or clarity in a solution. The turbidity is influenced by the concentration, size, shape, and dispersion of particles in the solution. If there is turbidity in gelatin, it can affect the visual appearance, color, clarity, and overall quality of products that contain gelatin. The nephelometric turbidity unit (NTU) can be used to quantify the turbidity of gelatin33. A higher NTU number indicates a greater presence of solid particles or dissolved compounds in gelatin, resulting in more significant cloudiness. It was discovered that the treatment T2 had the clearest water with a turbidity of 106.33±0.94 NTU, indicating excellent clarity. On the other hand, treatment T1 had the cloudiest water with a turbidity of 254.33±0.47 NTU.
These findings illustrate the impact of different treatments on turbidity levels. The results are also supported by Figure 3, which shows that T2 was clearer than both T0 and T1. The use of ultrasound can impact the turbidity of a substance, and this effect can vary depending on different factors like the duration, frequency, intensity, and temperature of the process. Additionally, the concentration and temperature of gelatin can also play an important role in the process. During the occurrence of cavitation, microbubbles can collapse and produce high-impact forces locally 34. These forces could break down dispersed or stuck particles in the solution35. By breaking down these particles, ultrasound could make the solution less turbid and clearer. Cavitation could also remove gases that were dissolved in the solution. When the microbubbles imploded, they caused local high pressure and temperatures locally11. It is possible to remove gases such as oxygen or nitrogen from a solution, which can cause it to become cloudy. If these gases are removed, ultrasound can be used to make the solution clearer.
Besides dispersing particles, ultrasound can also break down larger solid particles in the solution. When ultrasonic waves hit solid particles, they create enough force and pressure to crush these particles into smaller ones24. Ultrasound can be used to reduce the particle size and turbidity of a solution. The turbidity in gelatin is affected by various factors such as microstructure, hydrogen bonds, interactions between polymer chains, and water content. The type and source of gelatin, extraction method, concentration, and temperature can all impact the turbidity of the gelatin.
Viscosity and Gel Strength
A recent study showed that the viscosity of gelatin increased significantly when treated with acetic acid and ultrasound. The research found that sample T2, which underwent both treatments, had a higher viscosity than T1, which only received acetic acid treatment. This suggests that the combination of acetic acid and ultrasound has a significant impact on enhancing the viscosity of gelatin. The study’s findings indicate that the synergistic effect of acetic acid pretreatment and ultrasound is an effective method for positively influencing the viscosity characteristics of gelatin. This is due to the highly effective gelatin extraction process of acetic acid. The way acids react with carboxyl groups in gelatin can change the microstructure of the hydrogel and how it absorbs water36. Acetic acid produces gelatin with the highest gel strength and viscosity37. This is due to the ability of ultrasound to help hydrolyze the skin matrix more optimally by producing longer chains of amino acids. The cavitation effect of ultrasound helps remove the tropocollagen matrix from the skin, allowing the hydrolysis process to go more smoothly6. The viscosity is related to the average molecular weight of gelatin and the distribution of molecules, whereas the molecular weight is directly related to the length of the amino acid chain. This means that the longer the amino acid chain, the higher the viscosity38. Concentration and molecular weight of gelatin. The higher the concentration and molecular weight of gelatin, the higher the viscosity and gel strength39. The hydrodynamic interactions between the gelatin molecules themselves determine the viscosity of the gelatin. Furthermore, temperature also has an impact on viscosity40. As the temperature of gelatin rises above 40°C, its viscosity decreases rapidly. Moreover, the amount of water present in gelatin affects its viscosity. The lesser the water content, the more efficiently gelatin can form a gel.
The study investigated the gel strength of different gelatin samples (T0, T1, and T2). The control group (T0) showed a gel strength of 4.76±0.38 g. However, T1, which underwent a particular intervention, displayed a significantly higher gel strength at 197.62±21.5 g T2 exhibited the highest gel strength, measuring 334.88±10.15 g. These results suggest that both T1 and T2 treatments significantly improved gelatin strength when compared to the control (T0). It was found that T2 had superior gel strength compared to T1, indicating that the combination of acetic acid pretreatment and ultrasound was highly effective in enhancing gelatin strength. This is valuable information for applications where gel strength is crucial, such as in the production of gelatin-based products. The study also showed that higher hydroxyproline content was correlated with increased stability and gel strength. However, having a high hydroxyproline content alone cannot form a robust gel. The α chain is also essential for forming the triple helix structure in collagen and gelatin. The α chain represents a polypeptide chain that contributes to the triple helix structure of collagen. A higher α chain content is associated with increased gel strength23. Using acetic acid before ultrasound extraction breaks more collagen into gelatin, creating a stronger gel. This is due to the cavitation phenomenon caused by ultrasound41. The size of protein chains, the concentration and distribution of the molecular weight of collagen protein, and the hydrogen bonds formed between water molecules and OH groups in amino acids impact gel strength10. Gel strength varies with the distribution of molecular weights and amino acid composition, impacting its strength. Gelatin, which contains high molecular weight polypeptides, generally exhibits a high gel strength42. Ultrasound cavitation caused the tropocollagen matrix to break apart from the skin, leading to more α-, β-, and γ chains. This changed the strength of the gelatin gel43. The pattern of the gelatin protein shown in Figure 5 further reinforces this theory. Gelatin with a shorter chain length is unable to form a strong gel because it has fewer interjunction zones. Additionally, the content of amino acids such as proline and hydroxyproline also has an impact on the strength of the gel. Hydroxyproline is especially useful due to its ability to form hydrogen bonds with OH groups10,44.
The gel strength of T0 was low, and it could not form a gel after cooling at 5-7 ℃ for 16-18 h. This is because gelatin, without acid pretreatment and ultrasound assistance, cannot hydrolyze collagen into gelatin, producing short molecular chains and a weak network structure. It becomes difficult to form a gel when the gel strength is below 50 g. Additionally, the α and β chains of gelatin are not completely hydrolyzed, reducing the internal forces needed to form a gel and ultimately causing a decrease in gel strength. Short peptide chains cause lower interactions with water molecules, so they cannot form gels32,45. This differs from the combination treatment of acetic acid pretreatment and ultrasound-assisted extraction.
Melting point
The melting point is the temperature at which gelatin changes from solid to liquid. This study shows that the melting point increases with the application of acetic acid and ultrasound as pretreatment. Acetic acid alone can raise the melting point, but ultrasound enhances it further, as shown by samples T1 and T2. The study shows that there is a direct connection between the amount of hydroxyproline present and the melting point of gelatin. The more proline and hydroxyproline there are, the higher the melting point of gelatin will be. This is because proline and hydroxyproline form many hydrogen bonds in gelatin, and the number of hydrogen bonds formed affects how the gel forms and melts. Gelatin with few hydrogen bonds will form a gel at low temperatures with weak intermolecular bonds, so when it is released into a random coil, the gelatin will quickly melt46. The presence of proline and hydroxyproline can affect the melting point of gelatin. If the content of these amino acids is high, the melting point of gelatin will increase. Conversely, if the content is low, the gelatin will melt faster. It is worth noting that low melting point gelatin is usually of lower quality47.
pH
The pH test is a crucial step in evaluating the characteristics of gelatin, such as its viscosity and gel strength. Gelatin, which has a pH of around 7, is highly stable and can be extensively used in both food and non-food industries. It’s possible that the slightly acidic pH value found in T2 is due to the acid being trapped within the collagen matrix of the skin and not being released during the ultrasound process. When skin is soaked in acid, it will swell, but it will shrink again after being neutralized with running water. The pH value of gelatin may be affected by different factors, such as the pre-treatment prior to extraction and the duration of washing23. During the acid pretreatment process, the skin’s collagen fibers will undergo swelling, which will result in a reduction of the internal cohesive properties of the skin. The swelling effect will cause the amino acid bonds in the collagen molecule structure to open up. As a result, the acid will be trapped within the collagen fibril network. The trapped acid does not dissolve during the neutralization process, so it will be carried away during the extraction process, affecting the acidity level of gelatin48. The washing process is also an important step in removing acid residue from goat skin. Skin thickness is one of the influences in the neutralization process. Water cannot reach the inner layer of the skin matrix if the skin is very thick49.
The pH also affects the melting point of gelatin because it affects the electrical charge on the gelatin molecule. At low pH, the positively charged gelatin molecules repel each other, reducing their interaction. At high pH, the negatively charged gelatin molecules attract each other, increasing their interaction. Therefore, pH is directly proportional to melting temperature23,50. Gel strength refers to the firmness and elasticity of the gel formed by gelatin. The number of cross-links between gelatin molecules determines the gel strength. The more cross-links there are, the stronger the gel will be. However, these cross-links also cause gelatin molecules to be closer together and more resistant to melting51.
Sodium dodecyl sulfate-polyacrylamide gel electrophoresis (SDS-PAGE)
This study showed a different molecular weight distribution in each gelatin sample (Figure 4), which was an effect of the pretreatment process. The α1 and α2 chains with a molecular weight of around 127 kDa were clearly presented by T2 but were less intense in T1 and T0. This indicated the effectiveness of acetic acid pretreatment followed by ultrasound in aiding gelatin extraction from goat skin. The emergence of α-chains with high intensity reflected better functional properties. Additionally, a contrasting observation was noted for the β-chain (175 kDa), where T2 exhibited higher intensity than T1 and T0. These results indicated that gelatin produced with acetic acid and ultrasound pretreatment had good molecular stability due to its high content of α- and β-chains.
This study indicates that acetic acid pretreatment can reduce the molecular weight of gelatin proteins by breaking down polypeptide chains into smaller fragments45. Additionally, this pretreatment can potentially alter the shape of gelatin protein molecules by damaging their secondary and tertiary structures 52 10. On the other hand, the combination of acetic acid pretreatment with ultrasound can enhance the dispersion and solubilization of proteins in the sample due to the effect of cavitation 24 53. This effect allows the acid to denature the proteins thoroughly and evenly, thereby increasing the intensity of fragments from indigenous gelatin proteins, such as the γ, β, α1, and α2 chains.
Protein Solubility
The study shows that as the pH level increases from 2 to around 6, the solubility of all data points decreases. However, as the pH continues to rise, the solubility increases again. This suggests that gelatin has higher solubility in acidic conditions than alkaline conditions because the negatively charged amino acid groups ionize at low pH, reducing the attractive forces between gelatin molecules. Low pH levels can cause changes in protein structure and function due to environmental factors. There is an optimal pH point at which gelatin solubility reaches its maximum value. Among the three types of gelatin, T2 has the highest relative solubility, especially at higher pH levels. This indicates that the use of acetic acid-ultrasound pretreatment is more effective in enhancing gelatin solubility than just using acetic acid or not using any pretreatment. The acetic acid-ultrasound pretreatment reduces gelatin particle size, increases gelatin surface area, and alters gelatin surface properties, improving interactions between gelatin and solvent and contributing to its effectiveness. These interactions can create attractive forces between the hydrophobic parts of gelatin molecules, which in turn can lead to clustering and precipitation of the molecules54. However, there is a slight increase in solubility under alkaline pH conditions. When the pH level of a sample is higher than its isoelectric point (pI), negatively charged domains on gelatin molecules act as repulsive forces, making the sample more soluble55,56. The differences in solubility patterns observed between samples can be attributed to variations in the chain length, amino acid composition, molecular weight, and conformation of the two collagen types. These factors can influence how gelatin molecules interact with one another in solution, which ultimately affects their stability and solubility57.
T0 had high solubility at low NaCl concentration, indicating an easily soluble protein structure under neutral or slightly acidic conditions. However, the solubility of this protein decreased significantly as the NaCl concentration increased, which showed a denser and insoluble structure under high salt conditions. Sample T1 had lower initial solubility, but the solubility decreased slower with increasing NaCl concentration. This indicated a more stable protein structure due to acetic acid treatment, which limited solvent access to the protein. Sample T2, with acetic acid-ultrasound pretreatment, had the lowest solubility at all NaCl concentration levels. This combined treatment caused the protein structure to become very dense, resulting in difficulties dissolving under all conditions and easy precipitation. The escalation in salt concentration enhances hydrophobic interactions among protein chains, leading to competition for water with salt ions58. Furthermore, this considerable decrease may be associated with the salinization effect. As sodium chloride’s concentration increases, the ions’ strength also increases, making proteins less soluble and causing stimulated proteins to precipitate59. The results are in line with fundamental colloid chemistry principles, where salt concentration can impact interfacial interactions among protein molecules. Elevated NaCl levels can induce more hydrophobic interactions, causing gelatin molecules to aggregate, thereby reducing their relative solubility 56.
Emulsifying properties
The emulsion activity index (EAI) and emulsion stability index (ESI) are used to evaluate the capacity of gelatin as an emulsifier, a substance that helps to mix two immiscible liquids, such as oil and water. The lowest EAI value was observed in T0 (18.24±0.20 m2/g), representing gelatin without any additional treatment. This indicates that gelatin, lacking additional chemical or physical modifications, had a limited ability to form emulsions. The value of EAI increased significantly in T1 (23.58±0.34 m2/g), where gelatin was pretreated with acetic acid. This suggests that acetic acid could modify the structure of gelatin, increase its solubility, and consequently enhance its ability to form more stable emulsions. Additionally, acetic acid might influence the intermolecular interaction properties of gelatin, thereby affecting the quality of the produced emulsions. The highest EAI value was achieved by T2 (30.89±1.42 m2/g), involving gelatin pretreated with a combination of acetic acid and ultrasound. The use of ultrasound had a significant impact on the physical and structural properties of gelatin, resulting in increased stability of the emulsions formed. The ultrasonic waves caused changes in the structure of gelatin and promoted stronger interactions between gelatin molecules and the water and oil phases, leading to greater stability compared to other treatments2.
The ESI measures the stability of oil-in-water emulsions based on gelatin. It reflects the time required for the phases to separate, with higher ESI values indicating greater stability. In our study, significant differences (p<0.05) were observed between samples (Figure 6). The initial sample (T0) showed the lowest ESI at 24.90±2.13 min, which was due to its instability and susceptibility to phase separation because of its limited gelatin capacity. However, the addition of acetic acid (T1) resulted in greater stability (46.64±1.78 min) due to increased solubility and modification of the protein structure. Lastly, T2, which underwent ultrasound-induced partial hydrolysis, showed the highest ESI (62.63±2.20 min) and superior stability. The hydrolysis produced peptides that facilitated the formation of thin and flexible layers around the oil droplets, resulting in more excellent stability60. This study shows that the application of ultrasonic technology in the production of emulsions positively impacts EAI and gelatin ESI. Ultrasonic technology reduces gelatin particle size, improves particle distribution, and enhances emulsion stability by increasing hydrophobic groups in gelatin. This makes it easier for oil particles to bind to gelatin at the emulsion interface, which improves the activity of the emulsion22. Additionally, ultrasonic technology also leads to an increase in sulfhydryl groups in gelatin. Certain groups can create disulfide bonds between gelatin molecules8, when making an emulsion. This helps to strengthen the gelatin film at the emulsion interface. The use of ultrasonic technology not only improves the physical properties of the emulsion but also makes it easier for the gelatin and oil particles to mix. Additionally, this makes the gelatin film stronger where it meets the oil particles2.
Fourier transforms infrared spectra
FTIR spectroscopy is a technique used to investigate the functional groups in gelatin and analyze the chemical composition of various substances. The spectrum’s results provide essential information about the different types of chemical bonds present in the sample, such as C-H, O-H, N-H, C=O, and C=C bonds. Amide A in gelatin exhibits stretching vibrations of N-H groups, which are associated with hydrogen bonds, in the range of 3400 cm-1 61. Amide A in T0 shows a peak at wavenumber 3294.33 cm-1, which indicates the presence of stretching vibrations of the N-H groups involved in hydrogen bonding. In T1, there was a change in the peak of amide A to wavenumber 3295.85 cm-1, indicating structural changes in the N-H groups and hydrogen bonds in gelatin due to interactions with acetic acid. In T2, there was an increase in the intensity of the amide A peak at a wavenumber of 3296.61 cm-1, which indicates a more significant change in the stretching vibrations of the N-H groups and hydrogen bonding due to the use of ultrasound. The shift in the N-H stretching vibration band demonstrates how goat gelatin’s structure and hydrogen bonding were altered62. This change was caused by the pretreatment of goat skin with ultrasound and acetic acid before extracting the gelatin.
In amide B of T0, a peak is observed at the wave number of 2919.99 cm-1, indicating the stretching vibration of the C-H group in the gelatin molecule. The peak in T1 shifted to the wave number 2920.75 cm-1, pointing towards a change in the structural vibrations of the C-H groups due to the interaction with acetic acid. Moreover, T2 showed a more significant alteration in the stretching vibrations of the H-C groups with an increased peak at the wave number 2921.04 cm-1, which can be attributed to the use of ultrasound. The stretching vibrations of the C-H bonds in the carbon chains of goat gelatin are linked to amide B. Amide B has a low intensity in goat gelatin because hydrogen bonds are not involved in hydrogen bonds11. During the extraction of gelatin from goat skin, the pretreatment method used, such as acid, enzymes or ultrasound, can lead to changes in the frequency of Amide B in the gelatin, either low or high7,8. Similar results were reported by Mad-Ali et al.62, who extracted goat skin gelatin with NaOH pretreatment, resulting in the highest gelatin amide A (3268-3295 cm-1) and amide B (2920-2928 cm-1).
Amide I comprises peptide bonds between the carboxyl group (-COOH) of an amino acid and the amino group (-NH2) of another amino acid63. In the FTIR spectrum, amide I is usually marked by a peak or band around 1650-1690 cm-1, which describes the vibration of the C=O bond (carbonyl bond) in the amide group. The FTIR results for amide I of T0, T1, and T2 revealed a change in the absorption peaks of amide I in wave numbers 1627.72 cm-1, 1632.01 cm-1, and 1633.44 cm-1, respectively. The absorption peak at this wavenumber indicates the presence of amide bonds in the extracted goat gelatin. It was observed that T1 and T2 have higher absorption peaks than T0, which suggests that the structure of goat gelatin has changed after being extracted with acetic acid (T1) and then with ultrasound (T2). Acetic acid can interact with functional groups in goat gelatin, including the amide group. This interaction may result in a shift in the amide I peak in the FTIR spectrum2. The use of ultrasound in T2 can potentially affect the molecular structure of goat gelatin. The cavitation effect of ultrasound can cause ruptures or changes in the bonds in the structure of goat gelatin5,43. This could result in a change in the vibration of the C=O bond in amide I, which may be reflected in a peak shift in the FTIR spectrum.
A type of amide bond called amide II is found in the protein structure of gelatin, which is composed of protein gelatin40. Amide II comprises a peptide bond between the carboxyl group (-COOH) of one amino acid and the amino group (-NH2) of another amino acid. The use of acetic acid as an extraction solvent has a minimal effect on T1 and T2 and does not significantly impact the amide II bond in goat gelatin. When treated with acetic acid alone or with the addition of ultrasound, there was no substantial change in the amide bond that could be detected through FTIR analysis in this particular case. The use of acetic acid followed by ultrasound also did not affect amide II. When T2 is unable to create amide II in gelatin, it releases peptides or protein compounds. The absorption peak in the infrared spectrum between 1500-1600 cm-1 represents Amide II in gelatin and is related to amide II through the stretching vibration of the N-H bonds and the angular vibration of the C-N bonds in the amino acid structure of gelatin. Since N-H and C-N bonds are not involved in hydrogen bonds, amide II has a high intensity in gelatin. Amide II in gelatin can undergo a conformational change from a triple-double-helix structure to a beta- or random-sheet structure2,43.
In gelatin, the C-N-H groups move angularly due to amide III, which is relatively weak or absent63. It seems that the triple-helix section is lost during the extraction process, which leads to some changes in the structure of the gelatin. In particular, amide III is an aliphatic group that relates to the vibration of the N-H bond in the amide group of the gelatin molecules. However, the small changes in the amide III absorption peaks observed during the T0, T1, and T2 treatments suggest that the N-H bonds in goat gelatin did not change significantly after extraction. The FTIR spectrum showed a shift in the amide III peak, which suggests that the structure of gelatin was modified by the combination of acetic acid and ultrasound treatment. However, the wave value at the amide III peak did not differ between T1 and T2, indicating that the addition of ultrasound during the extraction process had no significant impact7.
Conclusion
The pretreatment of goat skin with acetic acid and ultrasound before gelatin extraction led to increased yield, hydroxyproline levels, gel strength, viscosity, melting point, and improved emulsifying properties. The cavitation effect of ultrasound facilitated protein production, promoting the production of α-, β-, and γ-chains. T2 had greater protein intensity for γ and β components, as well as α1 and α2 chains. Shifts in the peaks of amide A, amide B, amide I, amide II, and amide III were observed due to ultrasound cavitation, but these shifts did not significantly alter the structure of goat skin gelatin. Therefore, the combination of ultrasound and acetic acid is suitable for the pretreatment of gelatin preparation from goat skin, which can be applied commercially to improve production efficiency. It is recommended to use ultrasound for future studies on maximizing the extraction efficacy of gelatin during hot water extraction.
Acknowledgment
We gratefully acknowledge the financial support of the Research Fund under the KMITL Doctoral Scholarship [KDS2020/029] for this work.
Funding sources
The KMITL Doctoral Scholarship [KDS2020/029], King Monkut’s Institute of Technology Ladkrabang, Thailand.
Conflict of Interest
We confirm that we do not have any conflicts of interest, whether financial, personal, or otherwise, pertaining to the content discussed in the manuscript with any individuals or organizations.
Authors’ Contribution
Muhamad Hasdar: Conceptualization, Data curation, Formal analysis, Investigation, Methodology, Visualization, Writing – original draft, Writing – review & editing. Sitthipong Nalinanon: Conceptualization, Funding acquisition, Methodology, Project administration, Supervision, Writing – review & editing. Chodsana Sriket: Methodology, Supervision, Writing – review & editing.
Data Availability Statement
The manuscript incorporates all datasets produced or examined throughout this research study.
Ethics Statement
The document accurately and thoroughly presents the authors’ original research and analysis.
References
- Abdollahi M., Rezaei M., Jafarpour A., Undeland I. Sequential extraction of gel-forming proteins, collagen and collagen hydrolysate from gutted silver carp (Hypophthalmichthys molitrix), a biorefinery approach. Food Chem. 2018;242:568-578.
CrossRef - Zou Y., Wang L., Cai P., Li P., Zhang M., Sun Z., Sun C., Xu W., Wang D. Effect of ultrasound assisted extraction on the physicochemical and functional properties of collagen from soft-shelled turtle calipash. Int J Biol Macromol. 2017;105:1602-1610.
CrossRef - Sun Q., Zhang C., Li Q., Xia X., Kong B. Changes in functional properties of common carp (Cyprinus carpio) myofibrillar protein as affected by ultrasound‐assisted freezing. J Food Sci. 2020;85(9):2879-2888.
CrossRef - Usman M., Ishaq A., Regenstein J. M., Sahar A., Aadil R.M., Sameen A., Khan M.I., Alam A. Valorization of animal by-products for gelatin extraction using conventional and green technologies: a comprehensive review. Biomass Convers Biorefin. 2023;66(7):1-13.
CrossRef - Senarathna P.D.S., Marapana R.A.U.J. Comparative Analysis of the Effect of Ultrasound-Assisted and Conventional Water Bath Extraction Methods on the Physicochemical Characteristics of Tilapia Scales Gelatin. Journal of Aquatic Food Product Technology. 2021;30(7):893-906.
CrossRef - Shaik M.I., Chong J.Y., Sarbon N.M. Effect of ultrasound-assisted extraction on the extractability and physicochemical properties of acid and pepsin soluble collagen derived from Sharpnose stingray (Dasyatis zugei) skin. Biocatal Agric Biotechnol. 2021;38(11):102218.
CrossRef - Tu Z .C., Huang T, Wang H., Sha X. M., Shi Y., Huang X.Q., Man Z.Z, Li D.J. Physico-chemical properties of gelatin from bighead carp (Hypophthalmichthys nobilis) scales by ultrasound-assisted extraction. J Food Sci Technol. 2015;52:2166-2174.
CrossRef - Bangar S.P., Esua O.J., Sharma N., Thirumdas R. Ultrasound‐assisted modification of gelation properties of proteins: A review. J Texture Stud. 2022;53(6):763-774.
CrossRef - Aslam R., Alam M.S., Kaur J., Panayampadan A.S., Dar O.I., Kothakota A., Pandiselvam R. Understanding the effects of ultrasound processng on texture and rheological properties of food. J Texture Stud. 2022;53(6):775-799.
CrossRef - Mulyani S., Setyabudi F.M.C.S., Pranoto Y., Santoso U. Physicochemical properties of gelatin extracted from buffalo hide pretreated with different acids. Korean J Food Sci Anim Resour. 2017;37(5):708.
CrossRef - Ahmad T., Ismail A., Ahmad S.A., Khalil K.A, Awad E.A., Leo T.K., Imlan J.C., Sazili A.Q. Characterization of gelatin from bovine skin extracted using ultrasound subsequent to bromelain pretreatment. Food Hydrocoll. 2018;80(7):264-273.
CrossRef - Bergman I., Loxley R. Two improved and simplified methods for the spectrophotometric determination of hydroxyproline. Anal Chem. 1963;35(12):1961-1965.
CrossRef - Cansu Ü. Comparative evaluation of Different Separation and Concentration Procedures on Some Quality and Functional Properties of Fish Gelatin. Innovative Food Science & Emerging Technologies. 2023;83(1):103237.
CrossRef - Duthen S., Levasseur-Garcia C., Kleiber D., Violleau F., Vaca-Garcia C., Tsuchikawa S., Raynaud C.D., Daydé J. Using near-infrared spectroscopy to determine moisture content, gel strength, and viscosity of gelatin. Food Hydrocoll. 2021;115:106627.
CrossRef - Erge A., Eren Ö. Chicken gelatin modification by caffeic acid: A response surface methodology investigation. Food Chem. 2021;351(7):129269.
CrossRef - Hidayati D., Alfarisy M.U, Kurniawan F., Prasetyo E.N., Luqman A., Sa’adah N.N. Histological structure of striped catfish (Pangasius Hypophthalmus) skin from different body size (age) and its relation to the quality of gelatin based on the melting point. In: IOP Conference Series: Earth and Environmental Science. Vol 718. IOP Publishing; 2021:012075.
CrossRef - Moosavi‐Nasab M., Yazdani‐Dehnavi M., Mirzapour‐Kouhdasht A. The effects of enzymatically aided acid‐swelling process on gelatin extracted from fish by‐products. Food Sci Nutr. 2020;8(9):5017-5025.
CrossRef - Laemmli U.K. Cleavage of Structural Proteins During the Assembly of the Head of Bacteriophage T4. Nature. 1970;227(5259):680-685.
CrossRef - Jamilah B., Hartina M.R.U., Hashim D.M., Sazili A.Q. Properties of collagen from barramundi (Lates calcarifer) skin. Int Food Res J. 2013;20(2).
- Pearce K.N., Kinsella J.E. Emulsifying properties of proteins: evaluation of a turbidimetric technique. J Agric Food Chem. 1978;26(3):716-723.
CrossRef - Indriani S., Benjakul S., Kishimura H., Karnjanapratum S., Nalinanon S. Impact of extraction condition on the yield and molecular characteristics of collagen from Asian bullfrog (Rana tigerina) skin. LWT-Food Science and Technology. 2022;162(6):113439.
CrossRef - Huang T., Tu Z.C., Xinchen-Shangguan, Wang H., Zhang L., Sha X.M. Rheological and structural properties of fish scales gelatin: Effects of conventional and ultrasound-assisted extraction. Int J Food Prop. 2017;20(12):1210-1220.
CrossRef - Alipal J., Pu’Ad N.A.S.M., Lee T.C., Nayan N.H.M., Sahari N., Basri H., Idris M.I., Abdullah HZ. A review of gelatin: Properties, sources, process, applications, and commercialisation. Mater Today Proc. 2021;42(1):240-250.
CrossRef - Noor N.Q.I.M., Razali R.S., Ismail N.K., Ramli R.A., Razali U.H.M., Bahauddin A.R,. Zaharudin N., Rozzamri A., Bakar J., Shaarani S.M. Application of green technology in gelatin extraction: A review. Processes. 2021;9(12):2227.
CrossRef - Kripotou S., Stefanopoulou E., Culebras-Martinez M., Morales-Roman R.M., Ferrer G.G., Kyritsis A. Water dynamics and thermal properties of tyramine-modified hyaluronic acid-Gelatin hydrogels. Polymer (Guildf). 2019;178:121598.
CrossRef - Mushtaq F., Raza Z.A., Batool S.R., Zahid M., Onder O.C., Rafique A., Nazeer M.A. Preparation, properties, and applications of gelatin-based hydrogels (GHs) in the environmental, technological, and biomedical sectors. Int J Biol Macromol. Published online 2022.
CrossRef - Figura L.O., Teixeira A.A. Water activity. In: Food Physics: Physical Properties-Measurement and Applications. Springer; 2023:1-57.
CrossRef - Luo Q., Hossen M.A., Zeng Y., Dai J., Li S., Qin W., Liu Y. Gelatin-based composite films and their application in food packaging: A review. J Food Eng. 2022;313(1):110762.
CrossRef - Yang K.R., Tsai M.F., Shieh C.J., Arakawa O., Dong C.D., Huang C.Y., Kuo C.H. Ultrasonic-assisted extraction and structural characterization of chondroitin sulfate derived from jumbo squid cartilage. Foods. 2021;10(10):2363.
CrossRef - Wang X., Majzoobi M., Farahnaky A.. Ultrasound-assisted modification of functional properties and biological activity of biopolymers: A review. Ultrason Sonochem. 2020;65(7):105057.
CrossRef - Yu Z.L., Zeng W.C., Zhang W.H., Liao X.P., Shi B.. Effect of ultrasonic pretreatment on kinetics of gelatin hydrolysis by collagenase and its mechanism. Ultrason Sonochem. 2016;29(3):495-501.
CrossRef - Samatra M.Y., Noor N.Q.I.M., Razali U.H.M., Bakar J., Shaarani S.M. Bovidae‐based gelatin: Extractions method, physicochemical and functional properties, applications, and future trends. Compr Rev Food Sci Food Saf. 2022;21(4):3153-3176.
CrossRef - Benitez E.I., Lozano J.E.. Effect of gelatin on apple juice turbidity. Latin American applied research. 2007;37(4):261-266.
- Ramalho P.F, Valéria de-Campos J., Mattos A.L.A., de Sá -Moreira de S.F.M, Furtado A.A..L, de-Araujo N.A.R., Antonio C.J.M. An Enhancement to Development, Characterization and Potential Application of Gelatin Extracted from Native Brazilian Fish Skin (Colossoma macropomum). Journal of Aquatic Food Product Technology. Published online 2024:1-16.
- Dabbagh A., Abdullah B.J.J., Ramasindarum C., Abu K.N.H.. Tissue-mimicking gel phantoms for thermal therapy studies. Ultrason Imaging. 2014;36(4):291-316.
CrossRef - Moreira T.F.M., de-Oliveira A., da-Silva T.B.V., Dos-Santos A.R., Gonçalves O.H., Gonzalez R.S., Droval A.A., Leimann F.V. Hydrogels based on gelatin: Effect of lactic and acetic acids on microstructural modifications, water absorption mechanisms and antibacterial activity. LWT-Food Science and Technology. 2019;103:69-77.
CrossRef - Wulandari D., Triatmojo S., Erwanto Y., Pranoto Y. Physicochemical Properties and Amino Acid and Functional Group Profiles of Gelatin Extracted from Bovine Split Hide Cured by Acid. Pakistan Journal of Nutrition. 2016;15:655-661.
CrossRef - Tan C.C., Karim A.A., Uthumporn U., Ghazali F.C. Effect extraction temperature on the emulsifying properties of gelatin from black tilapia (Oreochromis mossambicus) skin. Food Hydrocoll. 2020;108:106024.
CrossRef - Elavarasan K., Kumar A., Uchoi D., Tejpal C.S., Ninan G., Zynudheen A.A. Extraction and characterization of gelatin from the head waste of tiger tooth croaker (Otolithes ruber). Waste Biomass Valorization. 2017;8:851-858.
CrossRef - Al-Hassan A.A. Gelatin from camel skins: Extraction and characterizations. Food Hydrocoll. 2020;101(4):105457.
CrossRef - Matinong A.M.E., Chisti Y., Pickering K.L., Haverkamp R.G. Collagen extraction from animal skin. Biology (Basel). 2022;11(6):905.
CrossRef - Rather J.A., Akhter N., Ashraf Q.S., Mir S.A., Makroo H.A., Majid D., Barba F.J., Khaneghah A.M., Dar B.N. A comprehensive review on gelatin: Understanding impact of the sources, extraction methods, and modifications on potential packaging applications. Food Packag Shelf Life. 2022;34:100945.
CrossRef - Lueyot A., Wonganu B., Rungsardthong V., Vatanyoopaisarn S., Hutangura P., Wongsa-Ngasri P., Roytrakul S., Charoenlappanit S., Wu T., Thumthanaruk B.. Improved jellyfish gelatin quality through ultrasound-assisted salt removal and an extraction process. PLoS One. 2022;17(11):e0276080.
CrossRef - Zhang T., Xu J., Zhang Y., Wang X., Lorenzo J.M., Zhong J. Gelatins as emulsifiers for oil-in-water emulsions: Extraction, chemical composition, molecular structure, and molecular modification. Trends Food Sci Technol. 2020;106(12):113-131.
CrossRef - Ali A.M.M., Kishimura H., Benjakul S. Physicochemical and molecular properties of gelatin from skin of golden carp (Probarbus Jullieni) as influenced by acid pretreatment and prior-ultrasonication. Food Hydrocoll. 2018;82(9):164-172.
CrossRef - Mikhailov O. V. Gelatin as It Is: History and Modernity. Int J Mol Sci. 2023;24(4):3583.
CrossRef - Sha X.M., Hu Z.Z., Ye Y.H., Xu H., Tu Z.C. Effect of extraction temperature on the gelling properties and identification of porcine gelatin. Food Hydrocoll. 2019;92(7):163-172.
CrossRef - Ahmad T., Ismail A., Ahmad S.A., Khalil K.A., Kumar Y., Adeyemi K.D., Sazili A.Q. Recent advances on the role of process variables affecting gelatin yield and characteristics with special reference to enzymatic extraction: A review. Food Hydrocoll. 2017;63:85-96.
CrossRef - Meyer M. Processing of collagen based biomaterials and the resulting materials properties. Biomed Eng Online. 2019;18(1):1-74.
CrossRef - Nurul A.G., Sarbon N.M. Effects of pH on functional, rheological and structural properties of eel (Monopterus sp.) skin gelatin compared to bovine gelatin. Int Food Res J. 2015;22(2):572-583.
- Osorio F.A., Bilbao E., Bustos R., Alvarez F. Effects of Concentration, Bloom Degree, and pH on Gelatin Melting and Gelling Temperatures Using Small Amplitude Oscillatory Rheology. Int J Food Prop. 2007;10(4):841-851.
CrossRef - Chua L.K., Lim P.K., Thoo Y.Y., Neo Y.P., Tan T.C. Extraction and characterization of gelatin derived from acetic acid-treated black soldier fly larvae. Food Chemistry Advances. 2023;2:100282.
CrossRef - Parker N.G., Povey M.J.W. Ultrasonic study of the gelation of gelatin: phase diagram, hysteresis and kinetics. Food Hydrocoll. 2012;26(1):99-107.
CrossRef - Chuaychan S., Benjakul S., Kishimura H. Characteristics of acid-and pepsin-soluble collagens from scale of seabass (Lates calcarifer). LWT-Food Science and Technology. 2015;63(1):71-76.
CrossRef - Kolotova D.S., Borovinskaya E.V., Bordiyan V.V., Zuev Y.F., Salnikov V.V., Zueva O.S., Derkach S.R. Phase Behavior of Aqueous Mixtures of Sodium Alginate with Fish Gelatin: Effects of pH and Ionic Strength. Polymers (Basel). 2023;15(10):2253.
CrossRef - Saallah S., Roslan J., Julius F.S., Saallah S., Mohamad R.U.H., Pindi W., Sulaiman M.R., Pa’ee K.F., Mustapa Kamal SM. Comparative study of the yield and physicochemical properties of collagen from sea cucumber (Holothuria scabra), obtained through dialysis and the ultrafiltration membrane. Molecules. 2021;26(9):2564.
CrossRef - Ali A.M.M., Benjakul S., Kishimura H. Molecular characteristics of acid and pepsin soluble collagens from the scales of golden carp (Probarbus jullieni). Emir J Food Agric. Published online 2017:450-457.
CrossRef - Ramle S.Z., Oslan S.N.H., Shapawi R., Mokhtar R.A.M, Noordin W.N.M., Huda N. Biochemical Characteristics of Acid-Soluble Collagen from Food Processing By-Products of Needlefish Skin (Tylosurus acus melanotus). Applied Sciences. 2022;12(24):12695.
CrossRef - Matmaroh K., Benjakul S., Prodpran T., Encarnacion AB, Kishimura H. Characteristics of acid soluble collagen and pepsin soluble collagen from scale of spotted golden goatfish (Parupeneus heptacanthus). Food Chem. 2011;129(3):1179-1186.
CrossRef - Ham Y.K., Noh S.W., Lee J.H., Yang N.E., Choi Y.S., Kim H.W. Optimization of Gelatin Extracting Condition from Korean Native Black Goat Skin and Quality Comparison with Commercial Gelatin. Food Sci Anim Resour. 2023;43(1):61.
CrossRef - Derkach S.R., Kolotova D.S., Kuchina Y.A., Shumskaya N.V. Characterization of fish gelatin obtained from Atlantic cod skin using enzymatic treatment. Polymers (Basel). 2022;14(4):751.
CrossRef - Mad-Ali S., Benjakul S., Prodpran T., Maqsood S. Characteristics and gel properties of gelatin from goat skin as influenced by alkaline-pretreatment conditions. Asian-Australas J Anim Sci. 2016;29(6):845.
CrossRef - Cao S., Wang Y., Xing L., Zhang W, Zhou G. Structure and physical properties of gelatin from bovine bone collagen influenced by acid pretreatment and pepsin. Food and Bioproducts Processing. 2020;121:213-223.
CrossRef

This work is licensed under a Creative Commons Attribution 4.0 International License.


